How to manage my Cloud from my Client Area?
Hashtags: #panel #server #restart #shutdown
Below we will show you how to view information about your service, usage statistics, and how to reboot it, all from your Client Area.
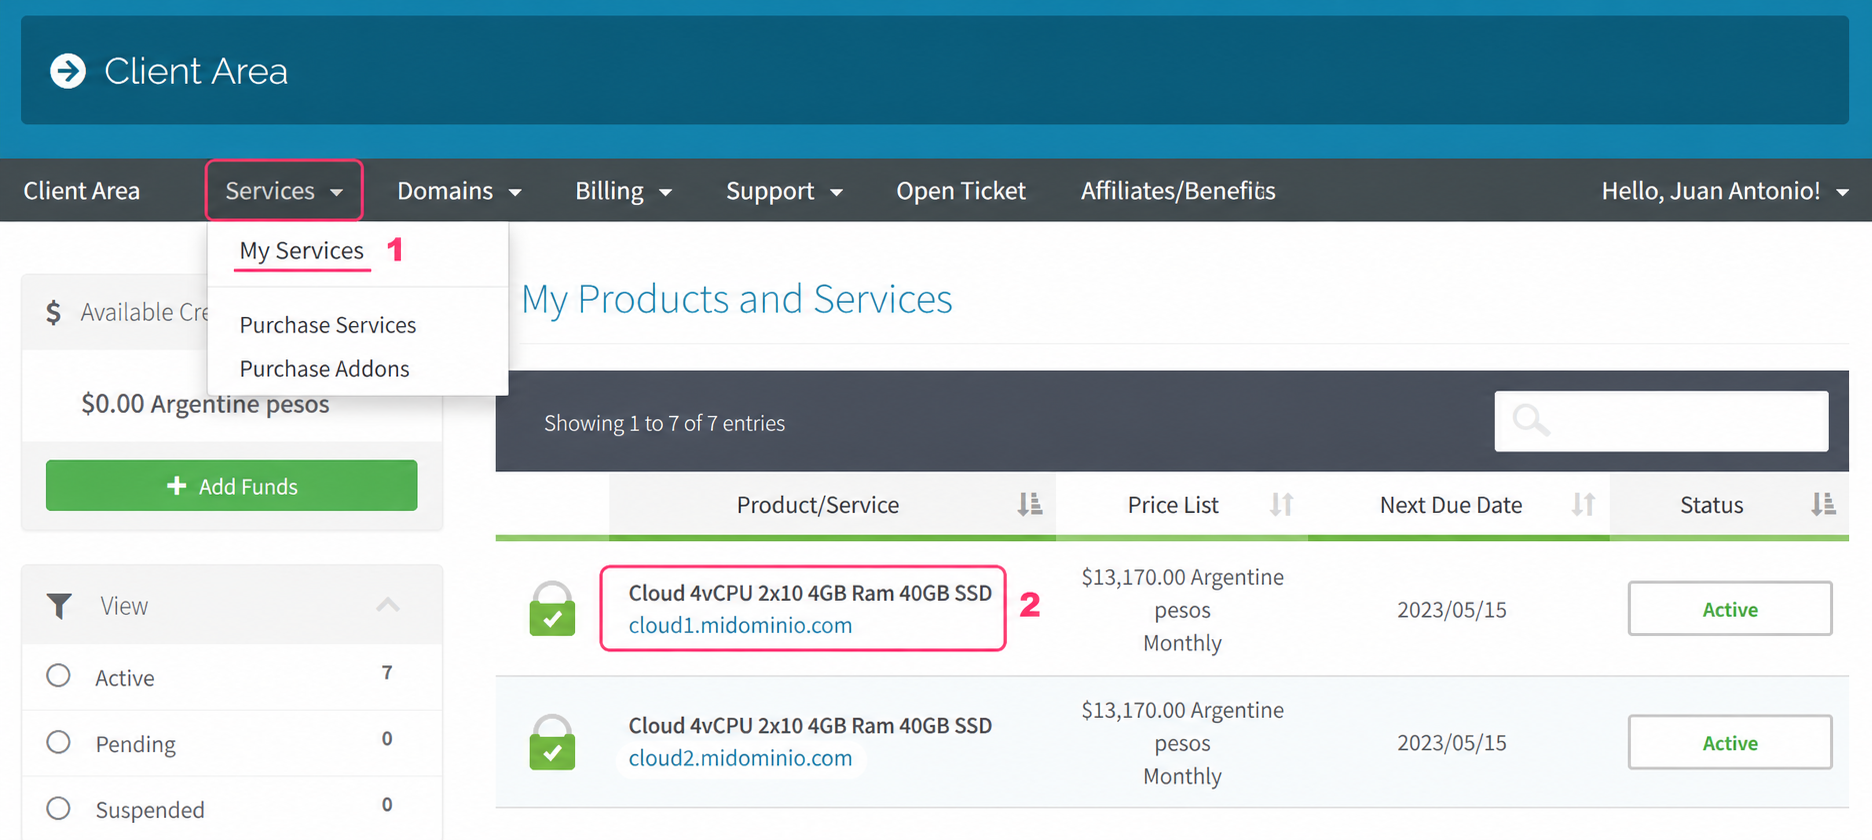
- First, go to Services in the gray menu, and then to My Services.
- Then, if you click on your cloud, you will be able to see its information and controls.
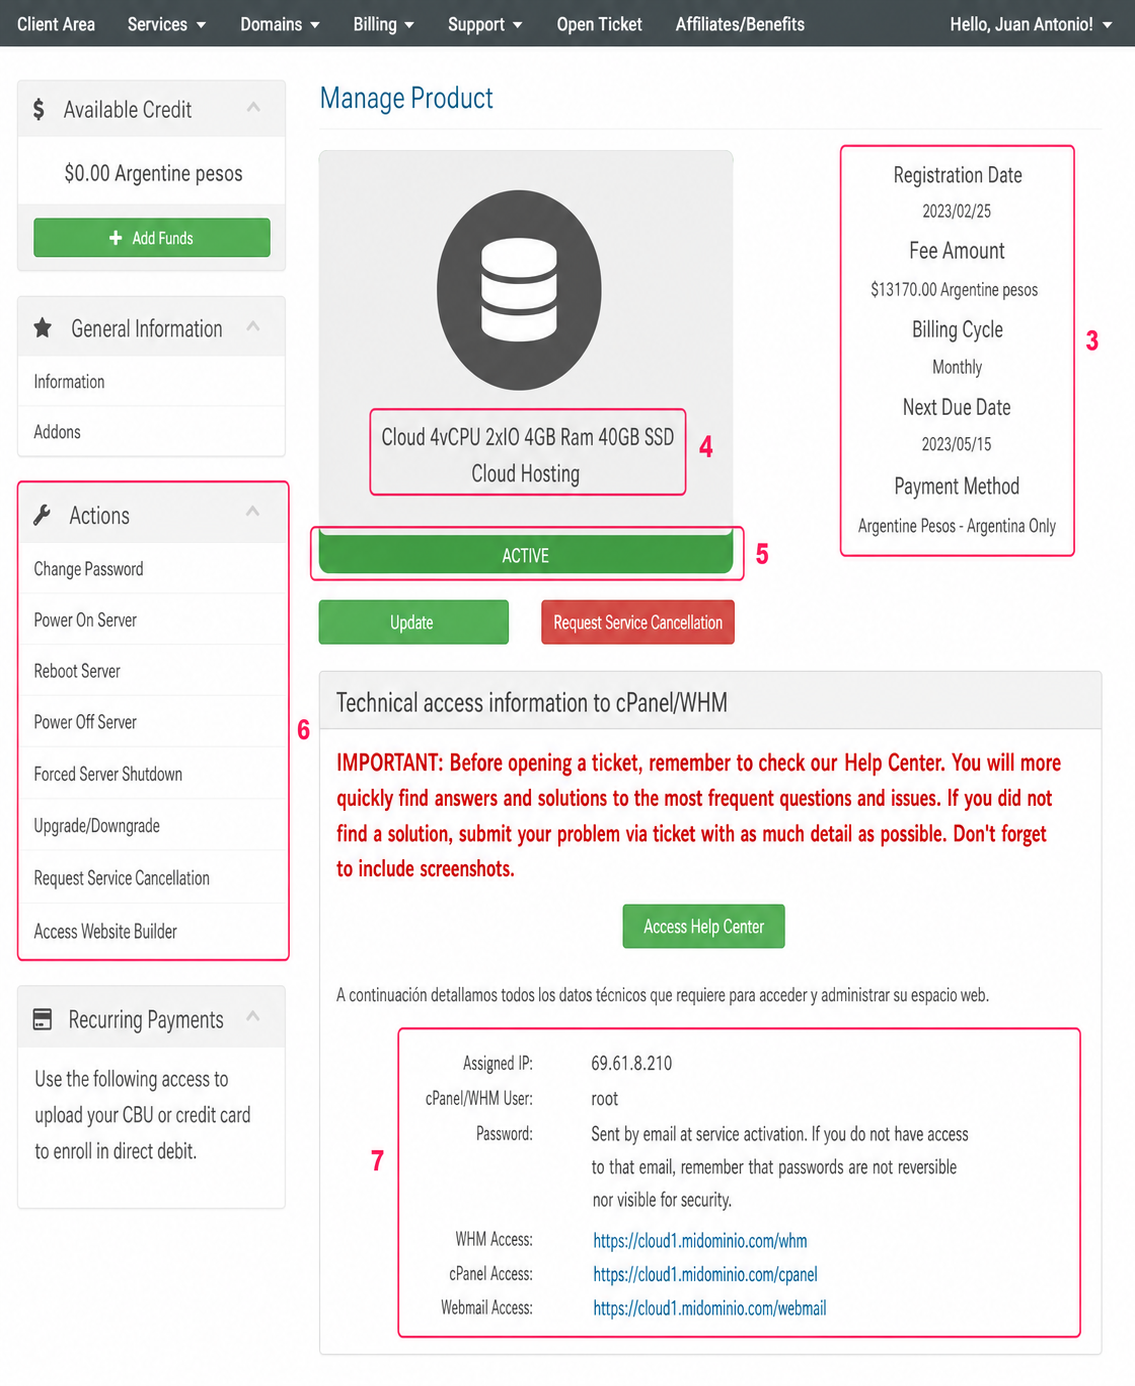
In your cloud management screen you will see the following:
- General information about your cloud, such as expirations, billing cycle, its price, etc.
- Hardware information of the cloud.
- The server status, whether it is active or inactive.
- In the Actions menu you can change your cloud password, power it on, power it off, reboot it, etc. Some of these options are also shown further below.
- In this section you will see access information for your cloud’s control panel, in the case you have cPanel/WHM. You will also see your server’s IP number.
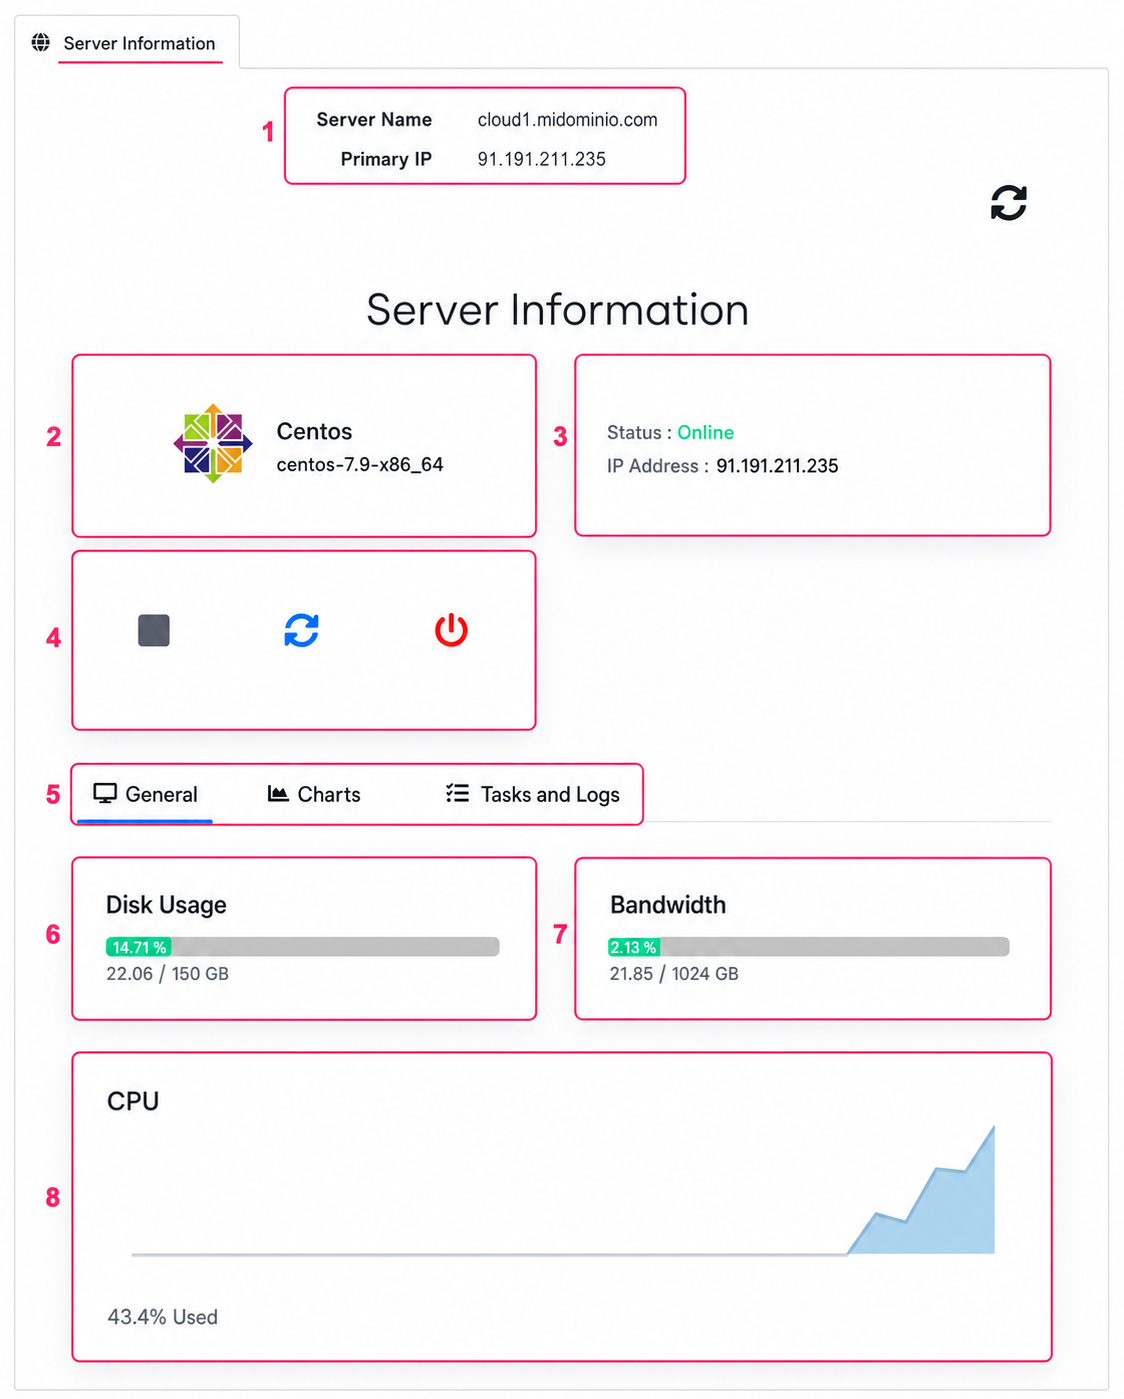
Below, you will see more information about your server. This panel may take a few seconds to appear. In this section you will see the following:
- The hostname and IP number of your server.
- The installed operating system and its version.
- Your server status and its IP number again.
- Controls to power off, power on, reboot or perform a full shutdown of your cloud.
- The General tab will show consumption information of your cloud.
- You will see disk space usage and its maximum capacity.
- You will see the consumed bandwidth and monthly limit.
- And finally you will see CPU usage. This is useful to monitor possible overloads.
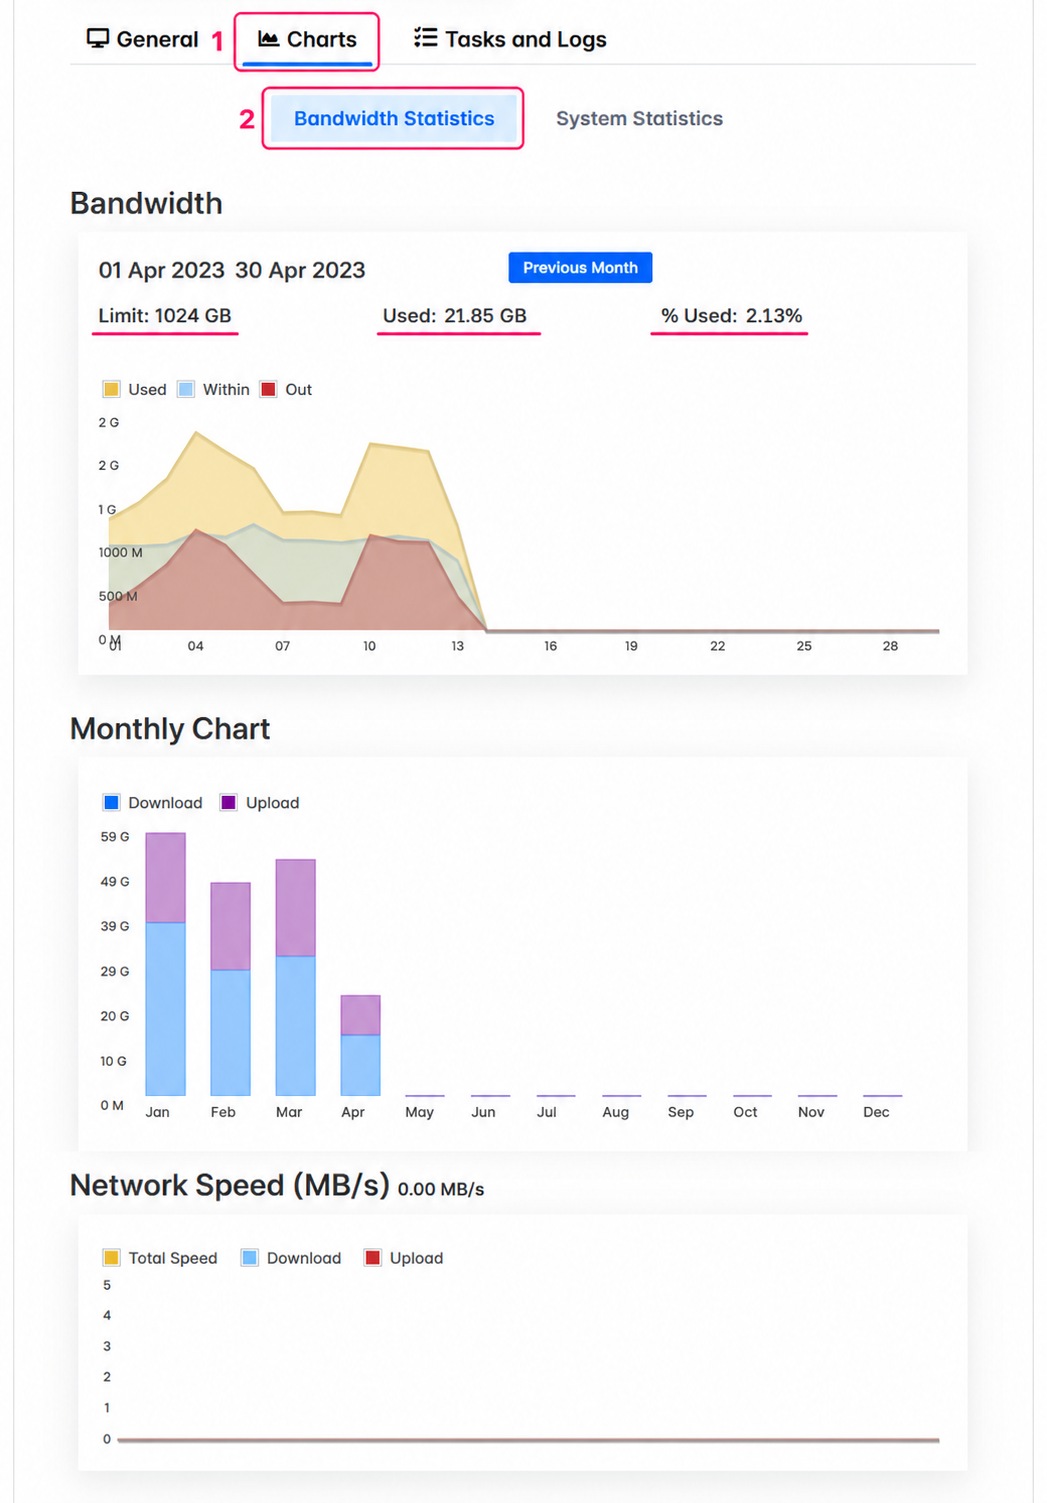
In the Charts tab, selecting Bandwidth Statistics, you will see bandwidth consumption statistics.
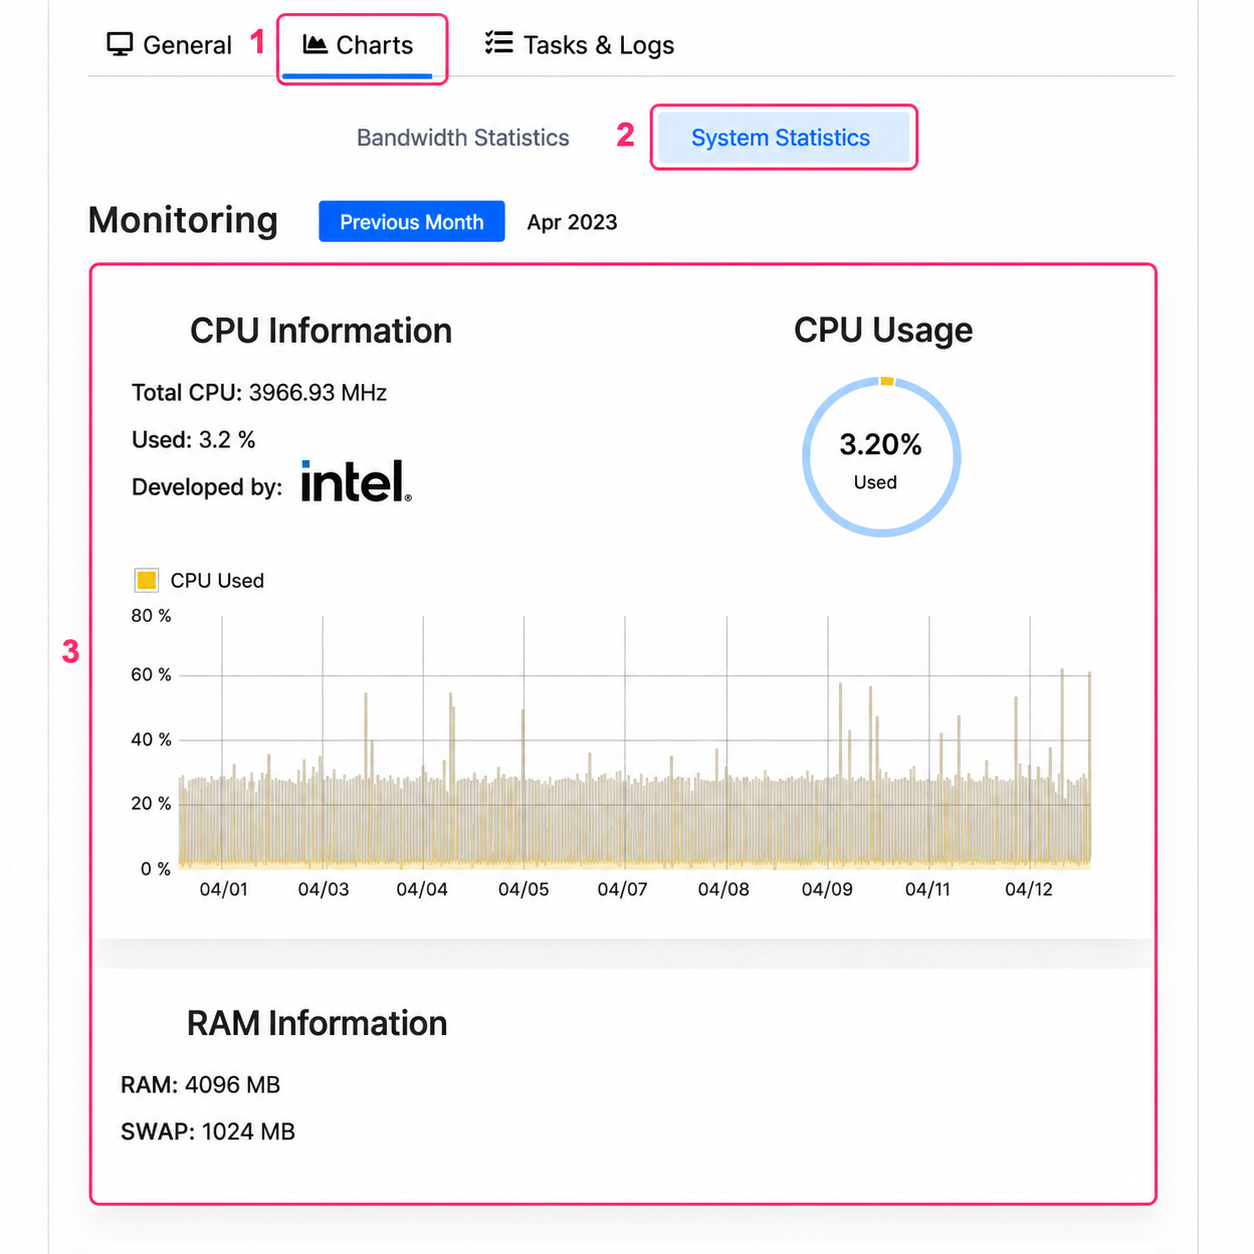
In the Charts tab, if you choose the System Statistics option, you will see CPU consumption statistics.
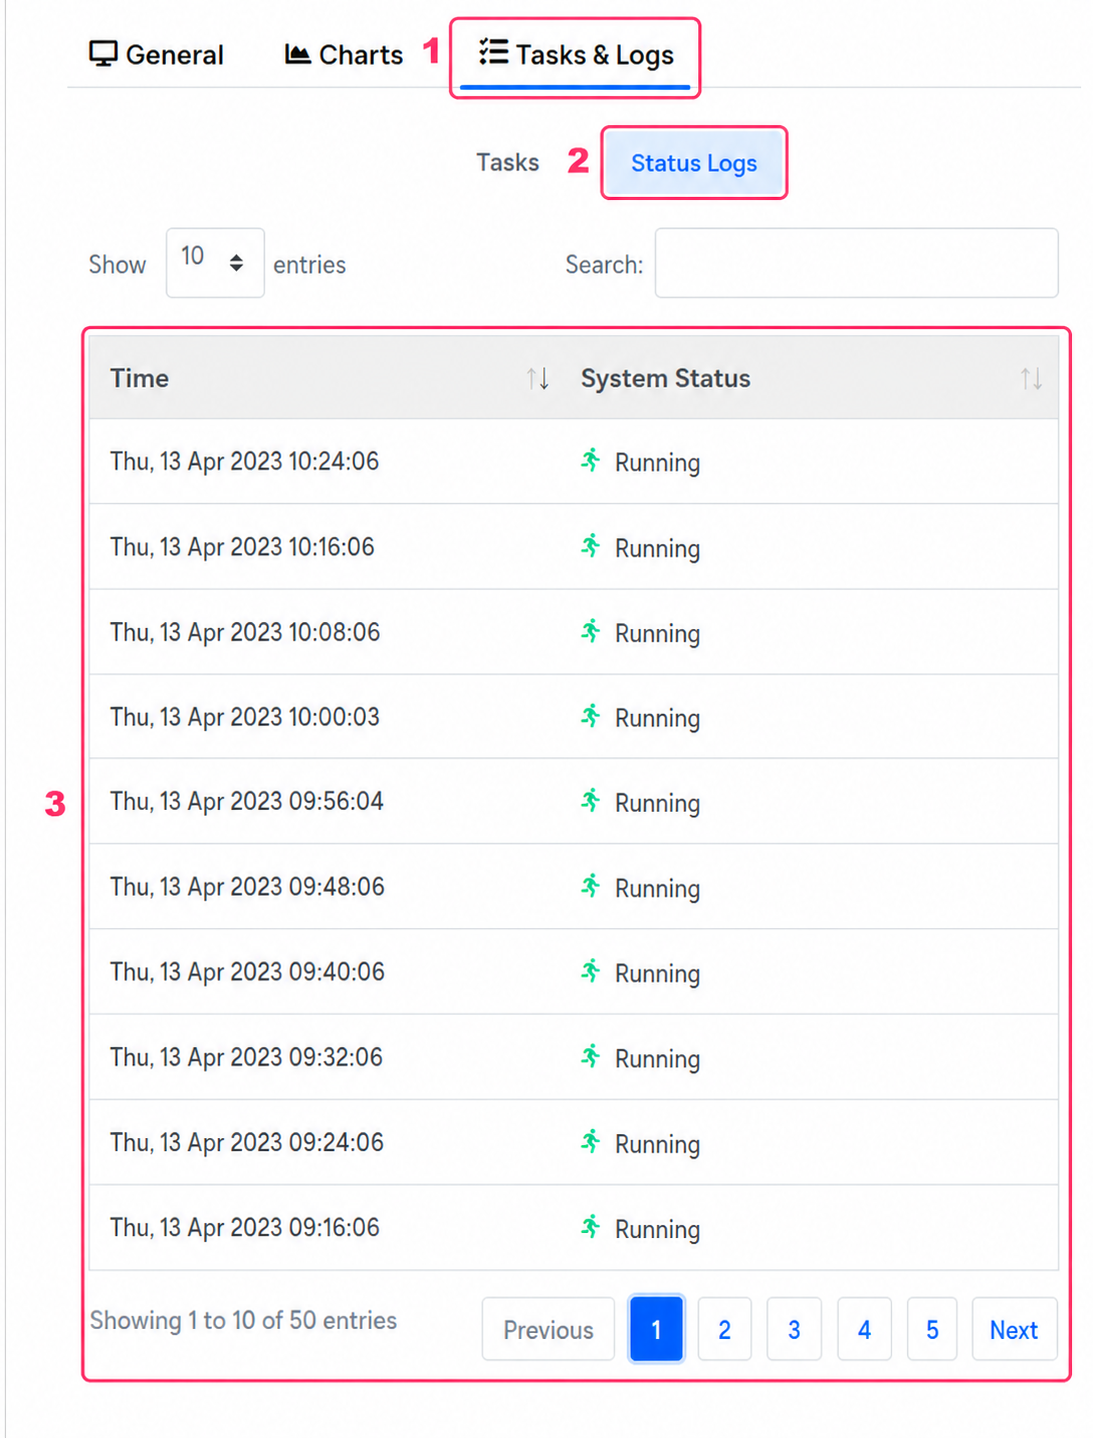
Finally, in the Tasks and Logs tab, selecting the Status Logs option, you will see the log of actions and states of your server. Here you will see if there was a reboot, shutdown, or change in the server’s state.