

How to view resource usage and usage statistics in cPanel?
Below you will find different tools that will give you information about the disk space and bandwidth usage of your hosting account.
In your control panel you will see, in the Statistics box on the right, the current Disk Space usage in Disk Usage and the Bandwidth usage in Bandwidth.
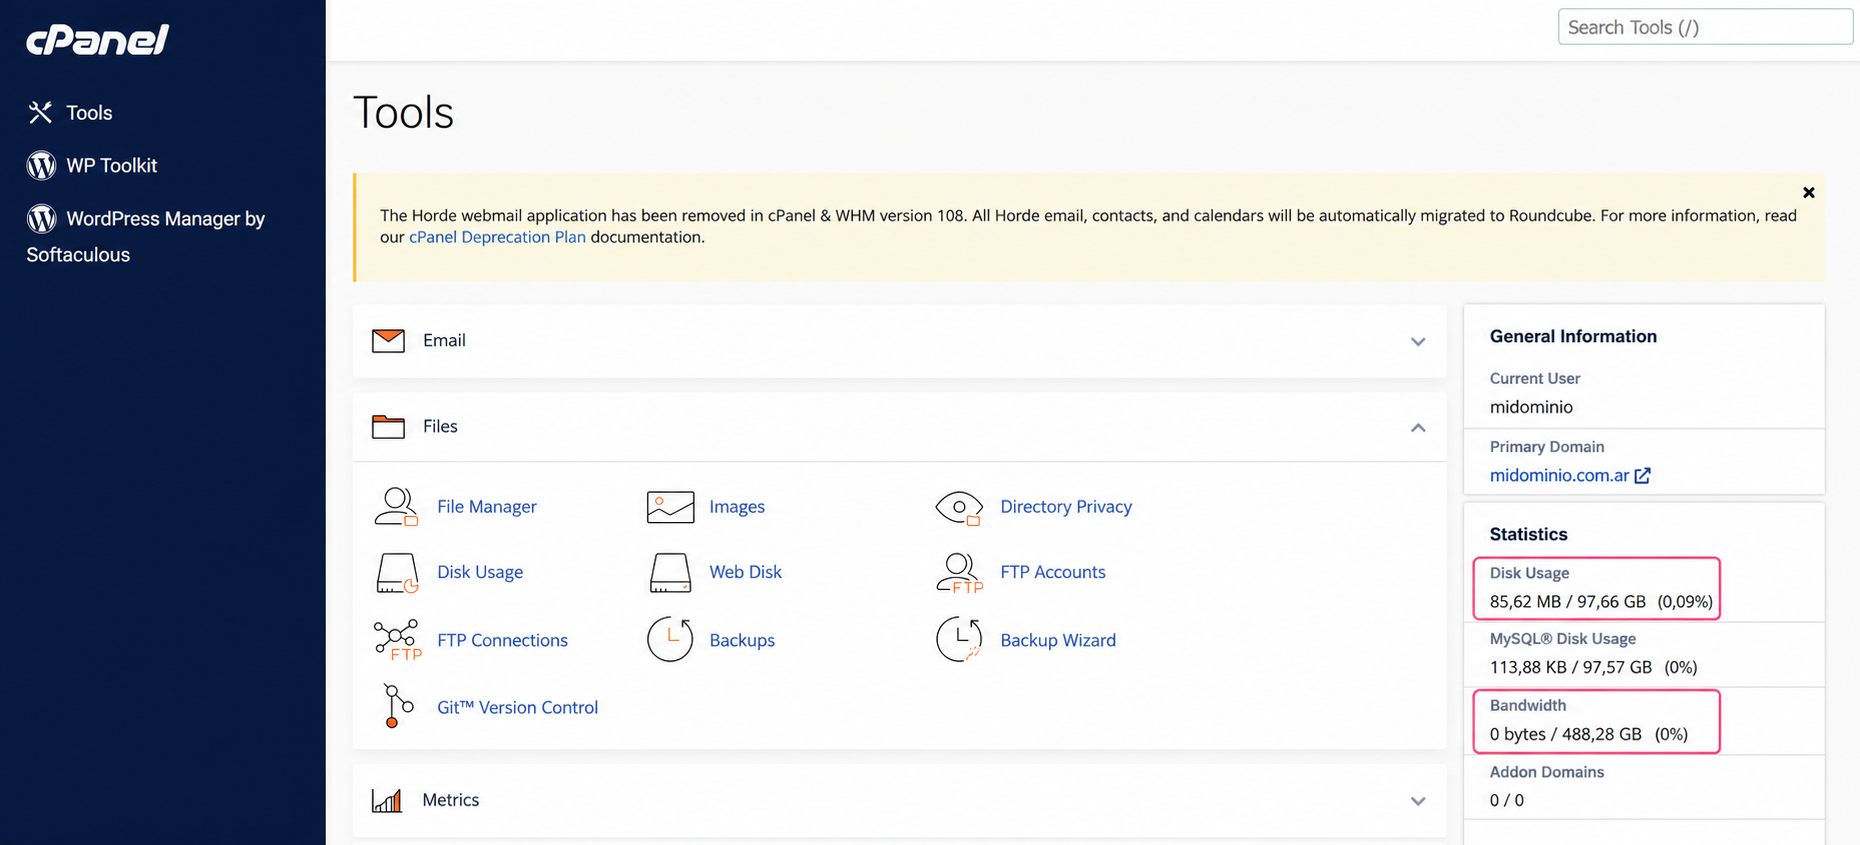
To see disk space and bandwidth usage in detail you will use the following tools:
Disk Space Usage
The disk space used can be viewed from the Disk Usage tool, inside the Files box.
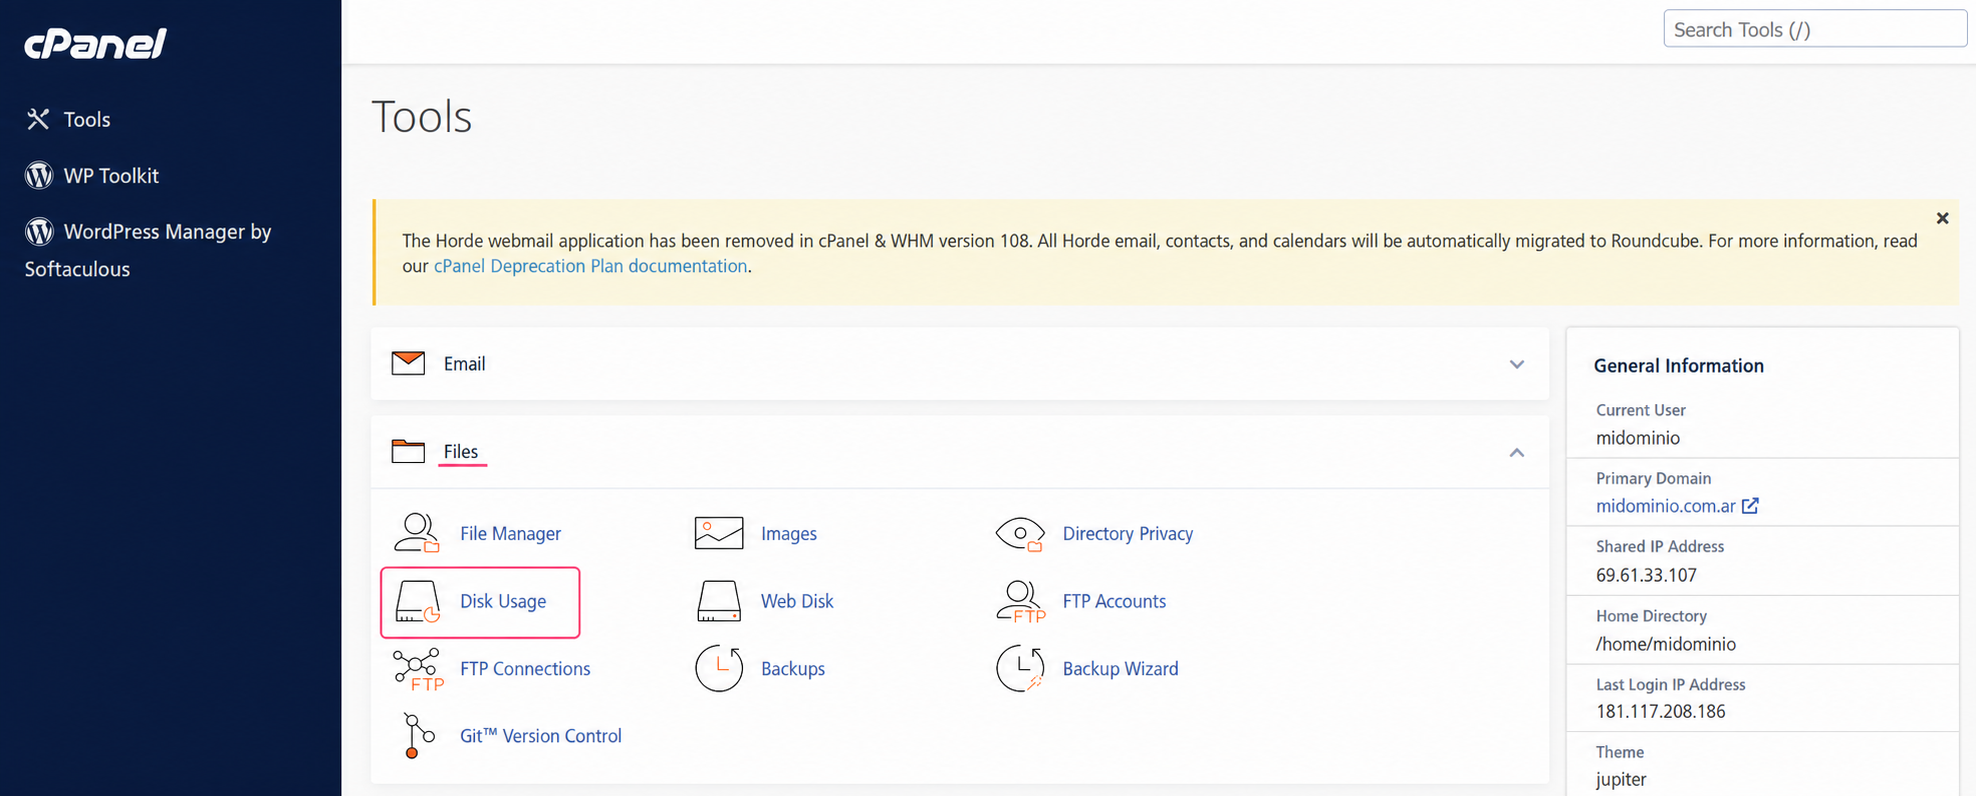
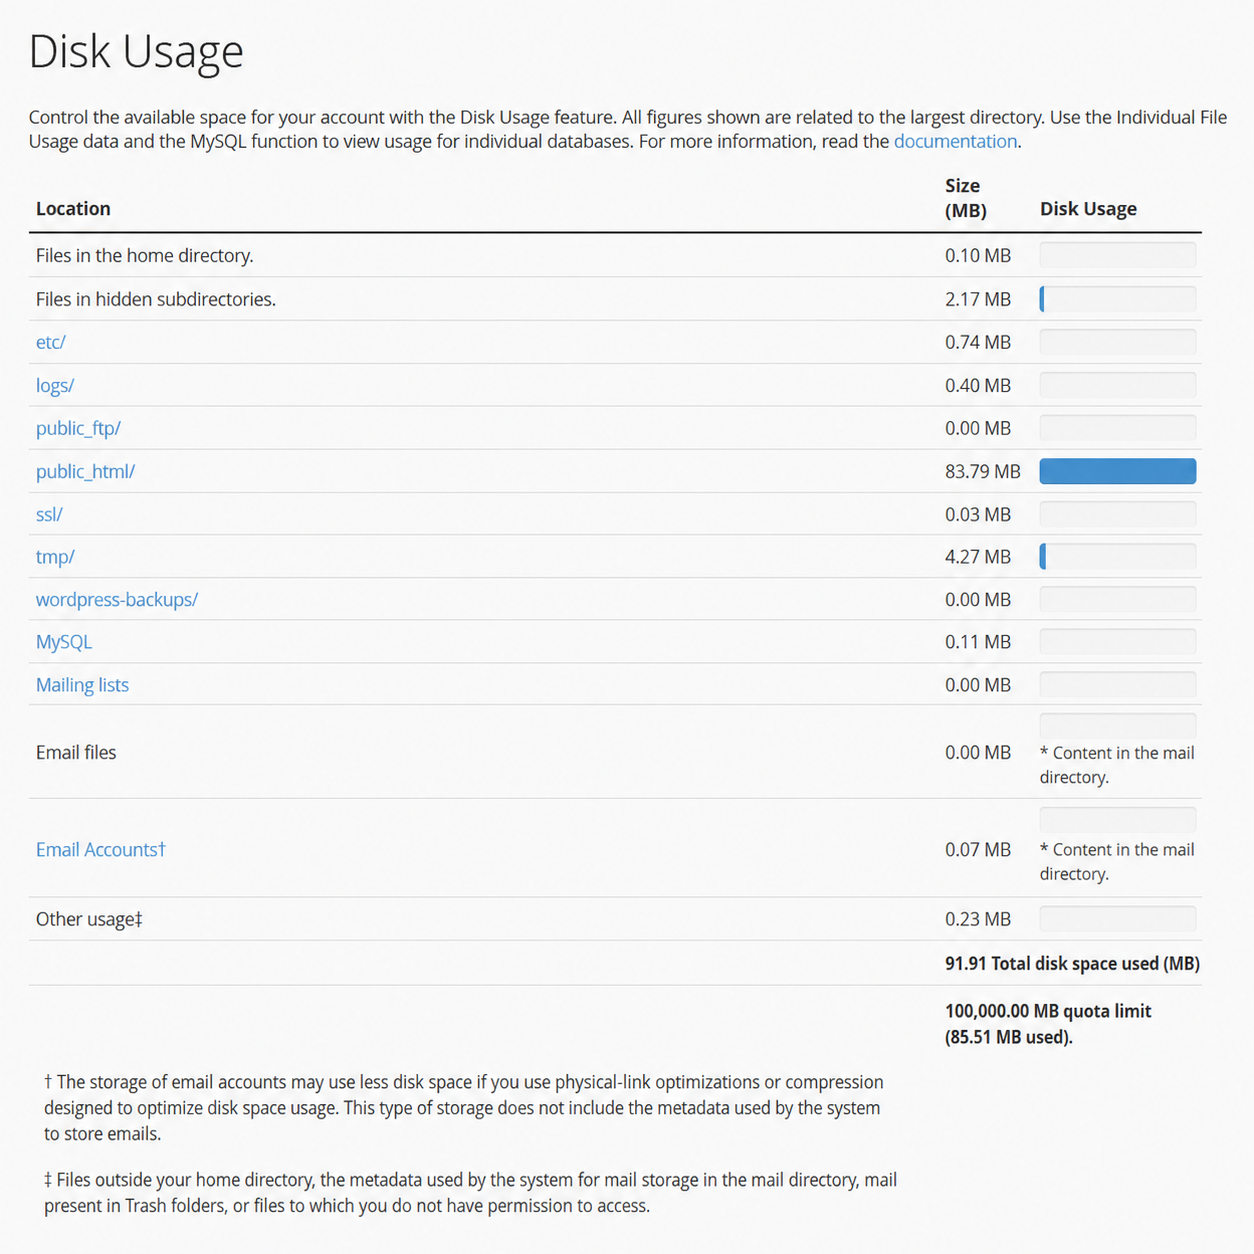
This tool will show you the space usage in each main area of your hosting plan.
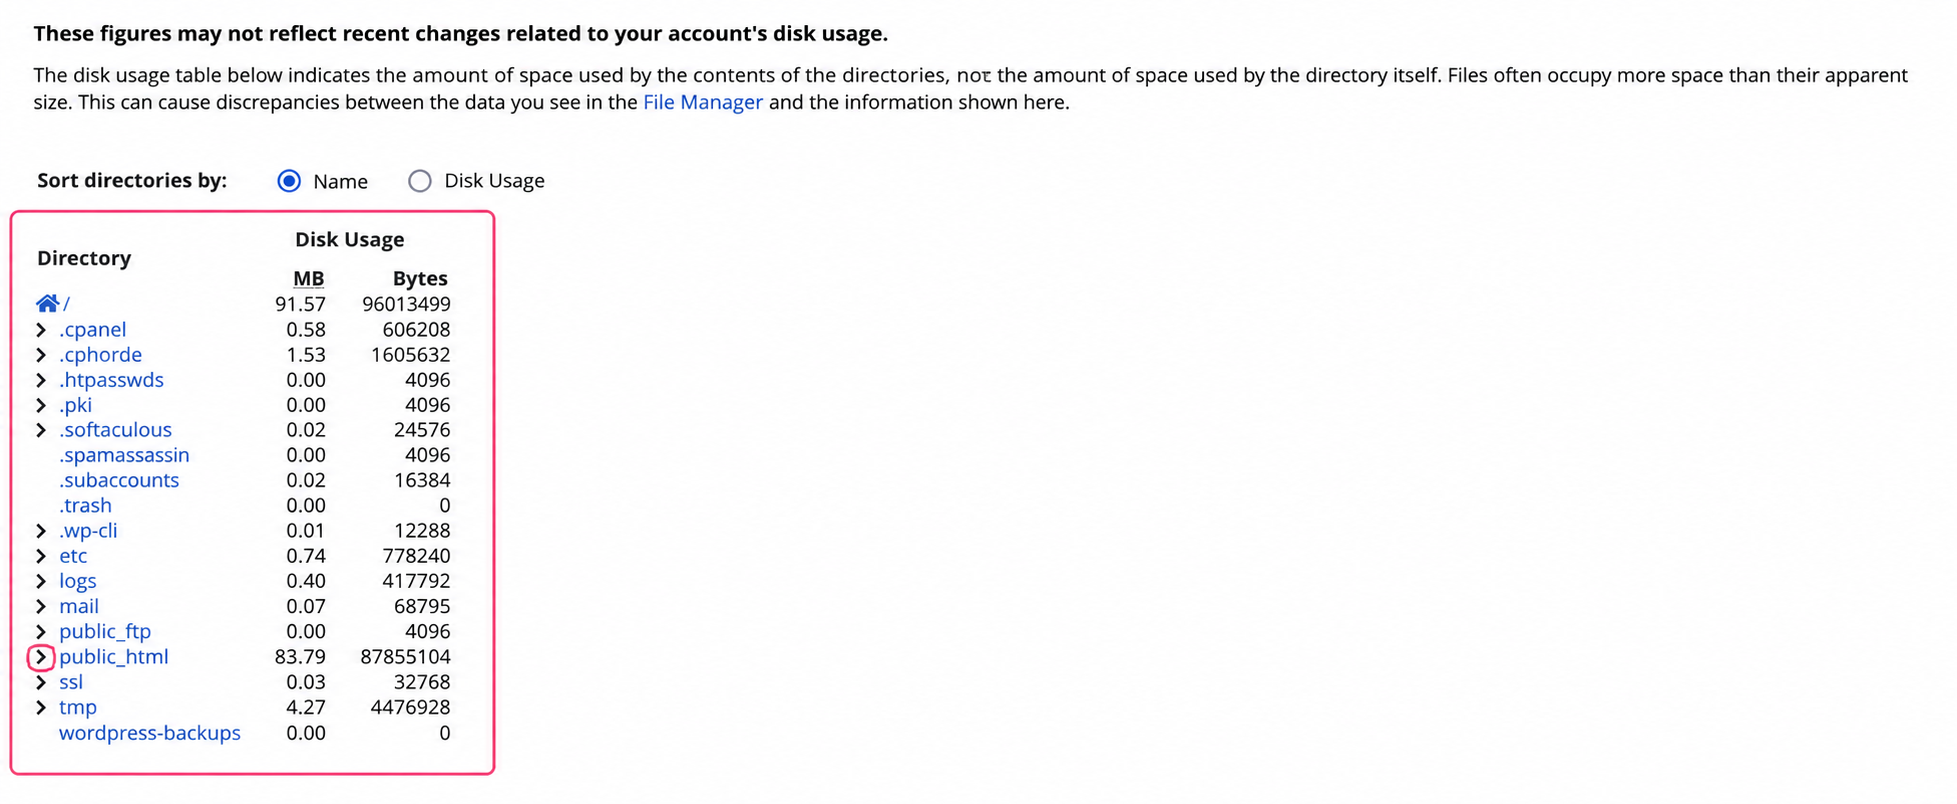
Below, you will find the space used in each directory or folder of your account. You can open each directory with the > symbol and, if you click on a directory, the File Manager will open to view your content in detail.
Bandwidth Usage
Bandwidth usage can be seen, in general, from the Bandwidth tool, inside the Metrics box.
And, if you want to see bandwidth usage in more detail, you can do so from the Awstats tool, which is also located in the Metrics box.
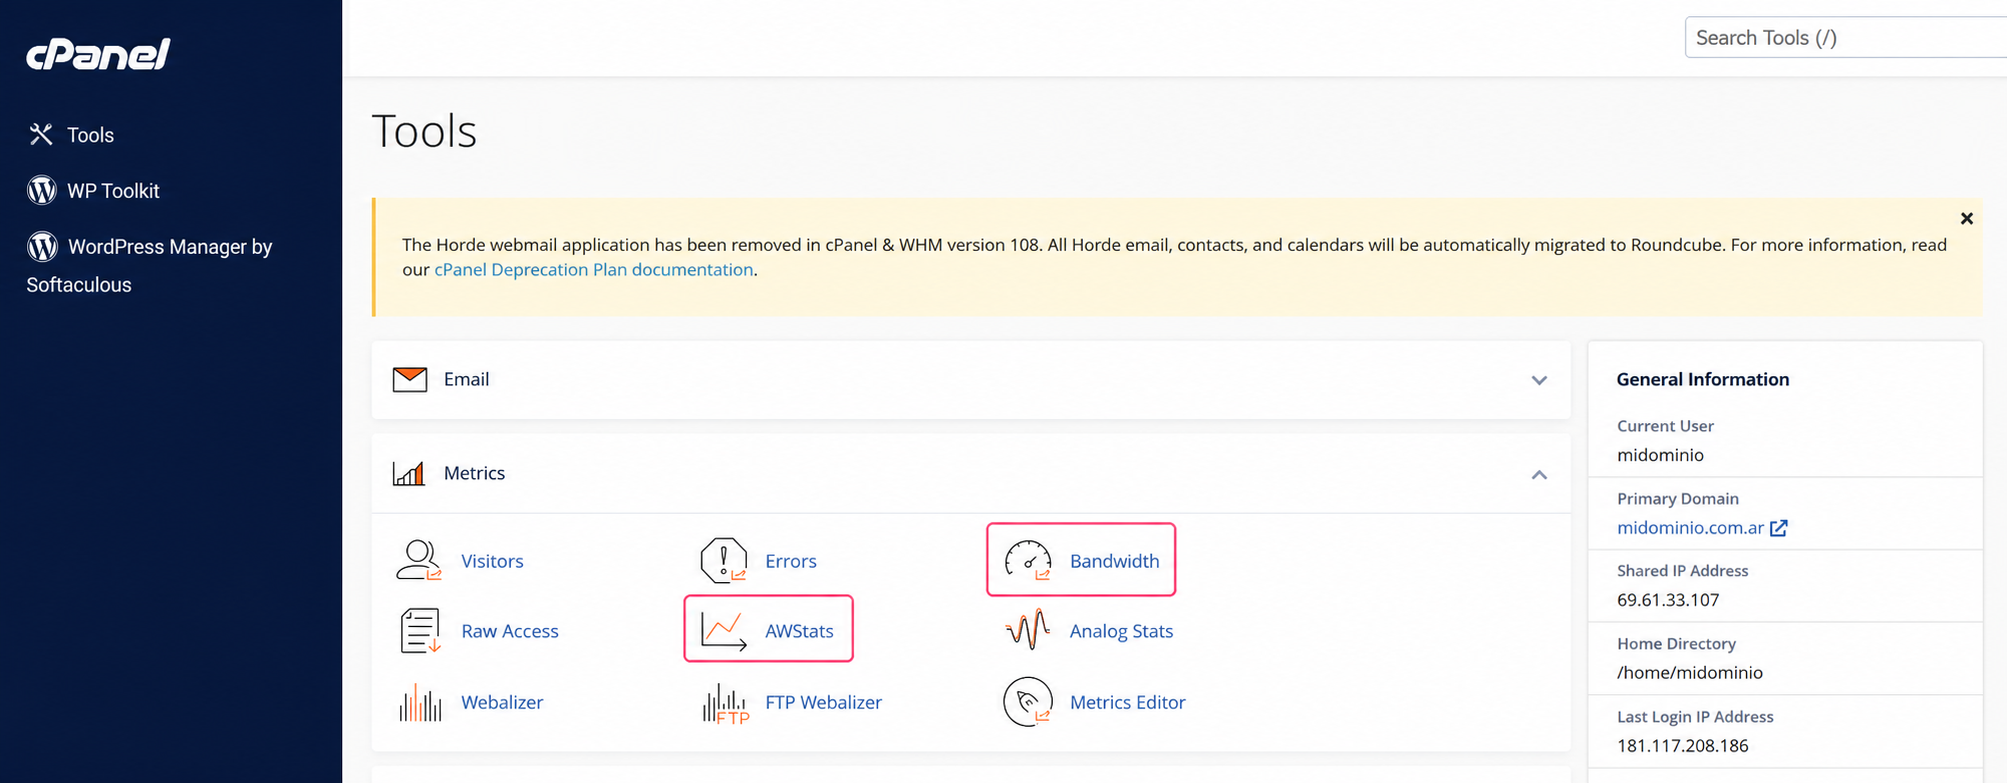
Bandwidth Tool
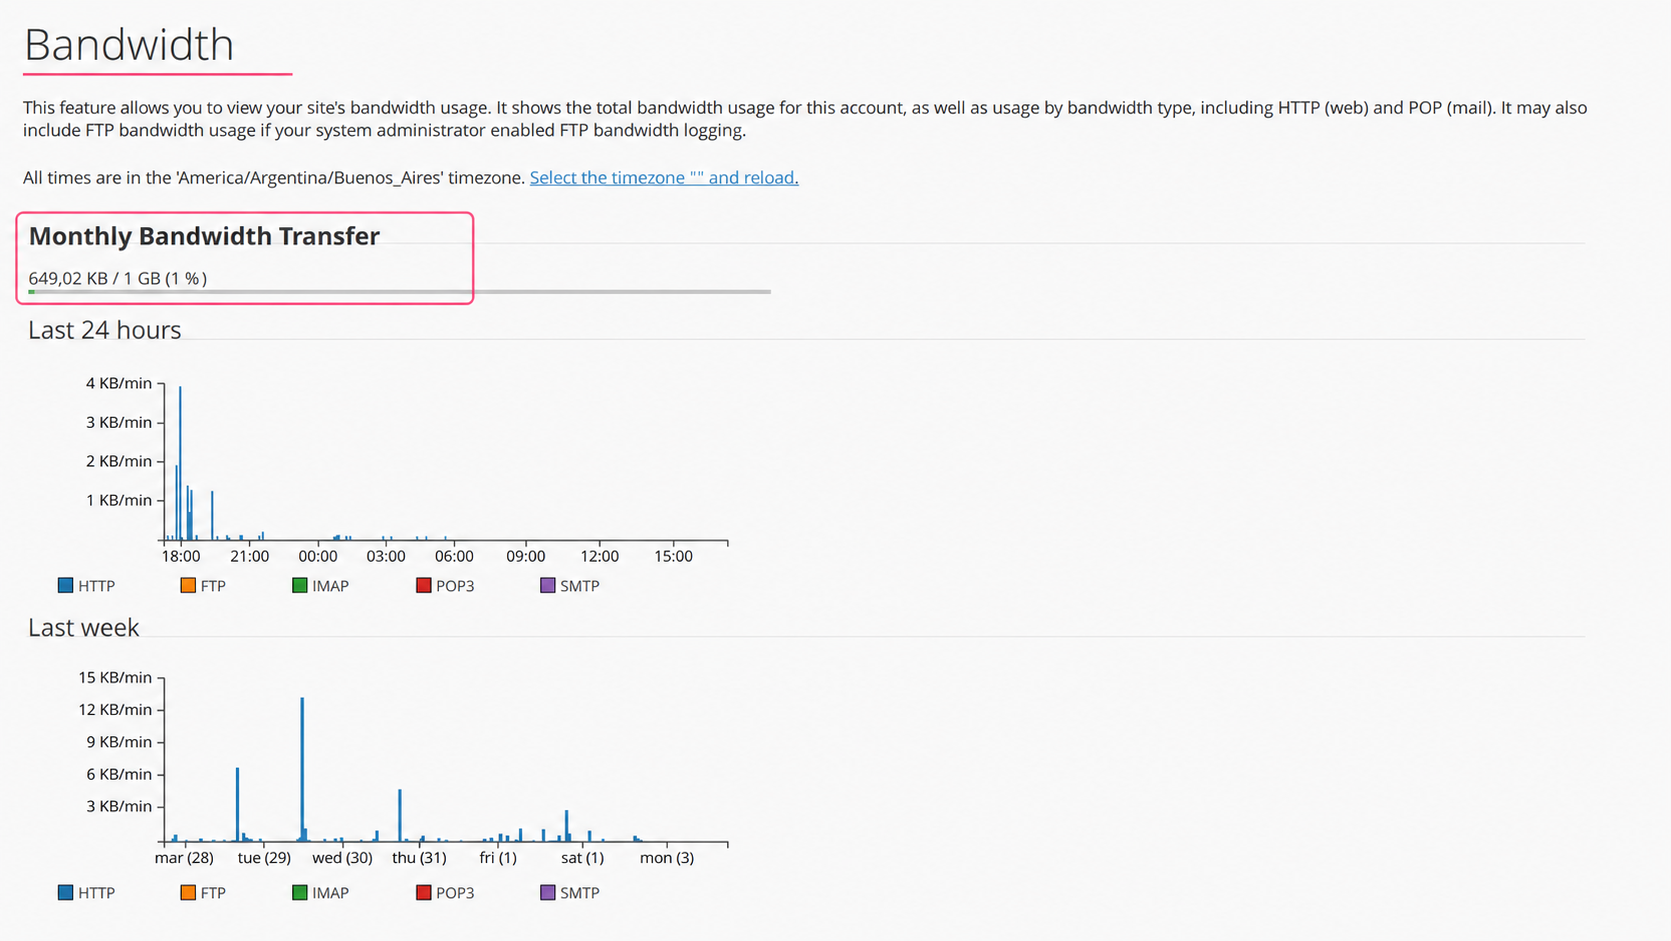
In this tool you will see the total bandwidth usage up to the moment and the limit that the hosting plan has.
Below, you will see the usage divided by services and time segments.
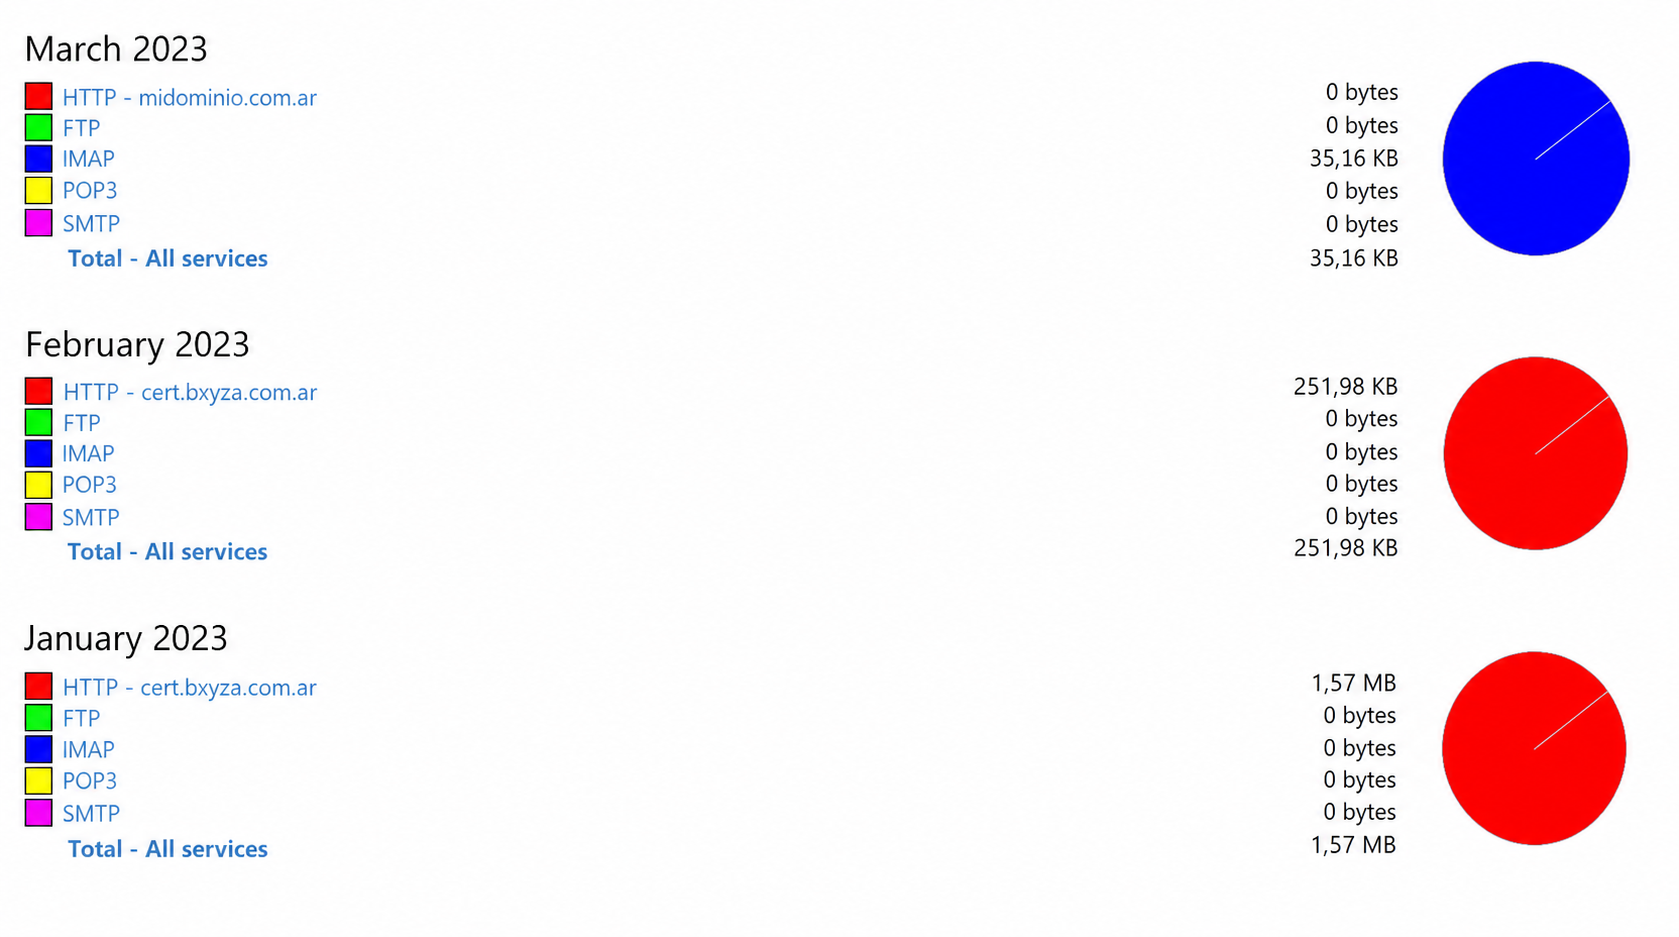
A little further down, you will see more detailed bandwidth usage generated by each main service of your hosting plan for each month.
This general overview will help you determine if the usage is stable or if there is a spike that you consider suspicious. This can be indicative of a virus in the account.
Awstats Tool
If you want to see bandwidth usage in the most detailed way possible, the best tool is Awstats.
If your website opens in browsers as **https://**yourdomain.com then go to the SSL version of your domain. If, instead, the website opens as **http://**yourdomain.com (non-secure mode) then access the domain without SSL.
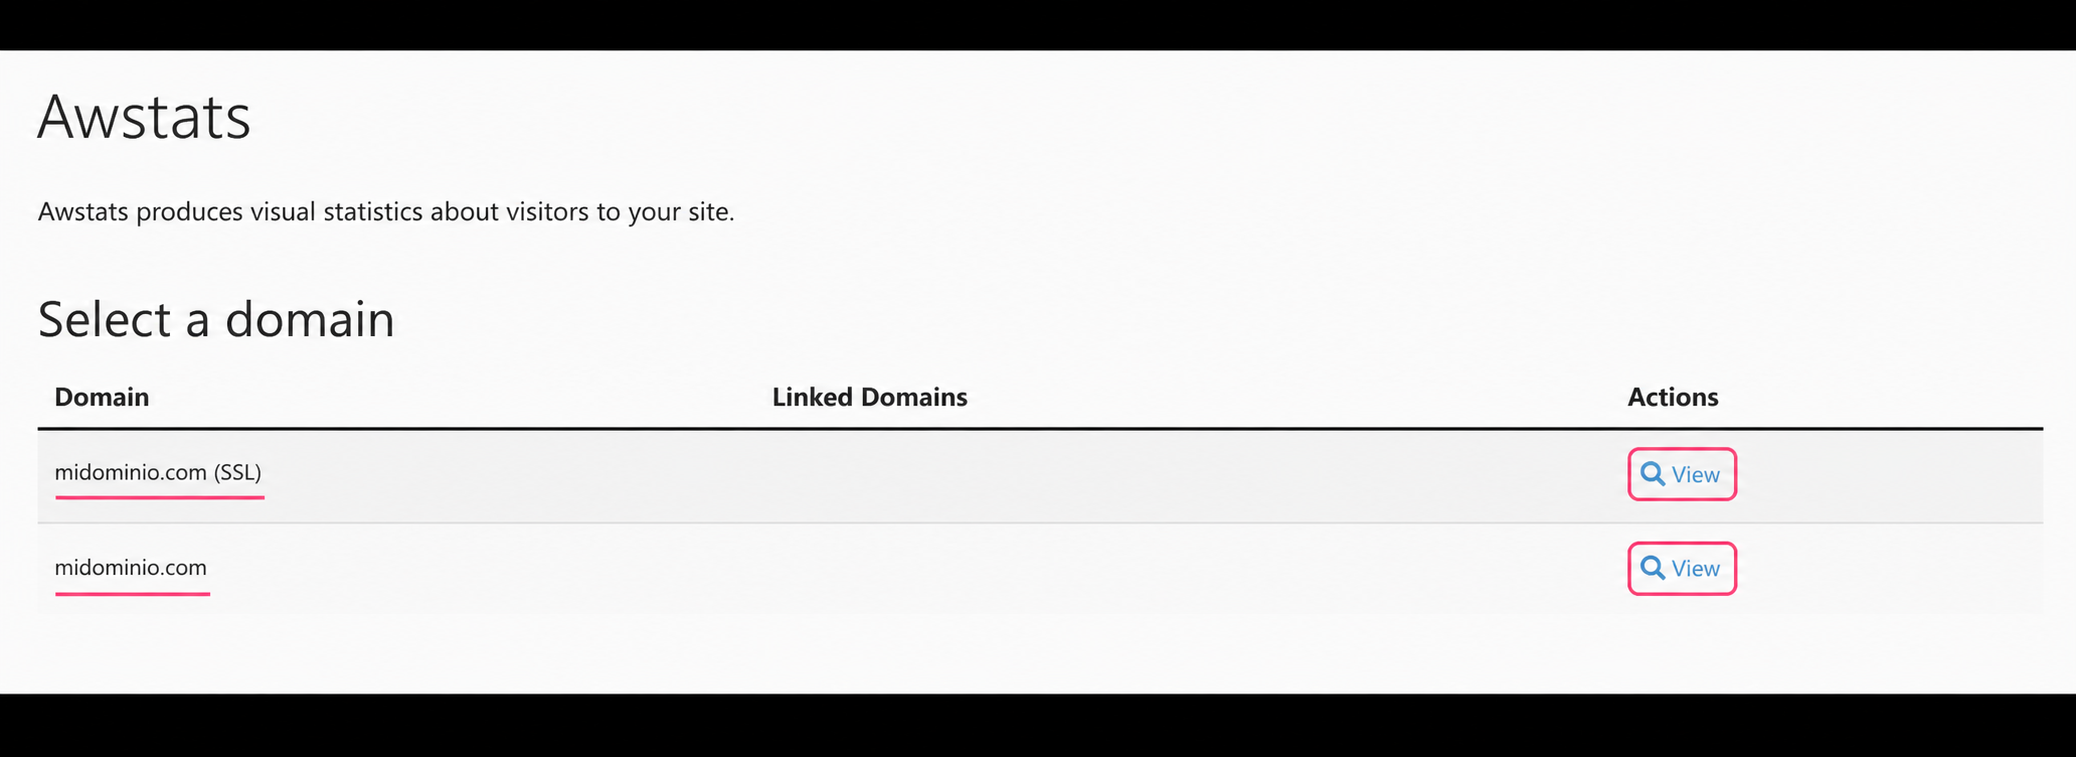
When you access the tool you will see several areas with information about bandwidth usage:
- You will see the date the metrics in this tool were updated.
- You will be able to choose different periods to show the usage for that time.
- In the center, you will see the usage for each month. This section is the first place to check if a suspicious difference in usage is detected compared to previous months.
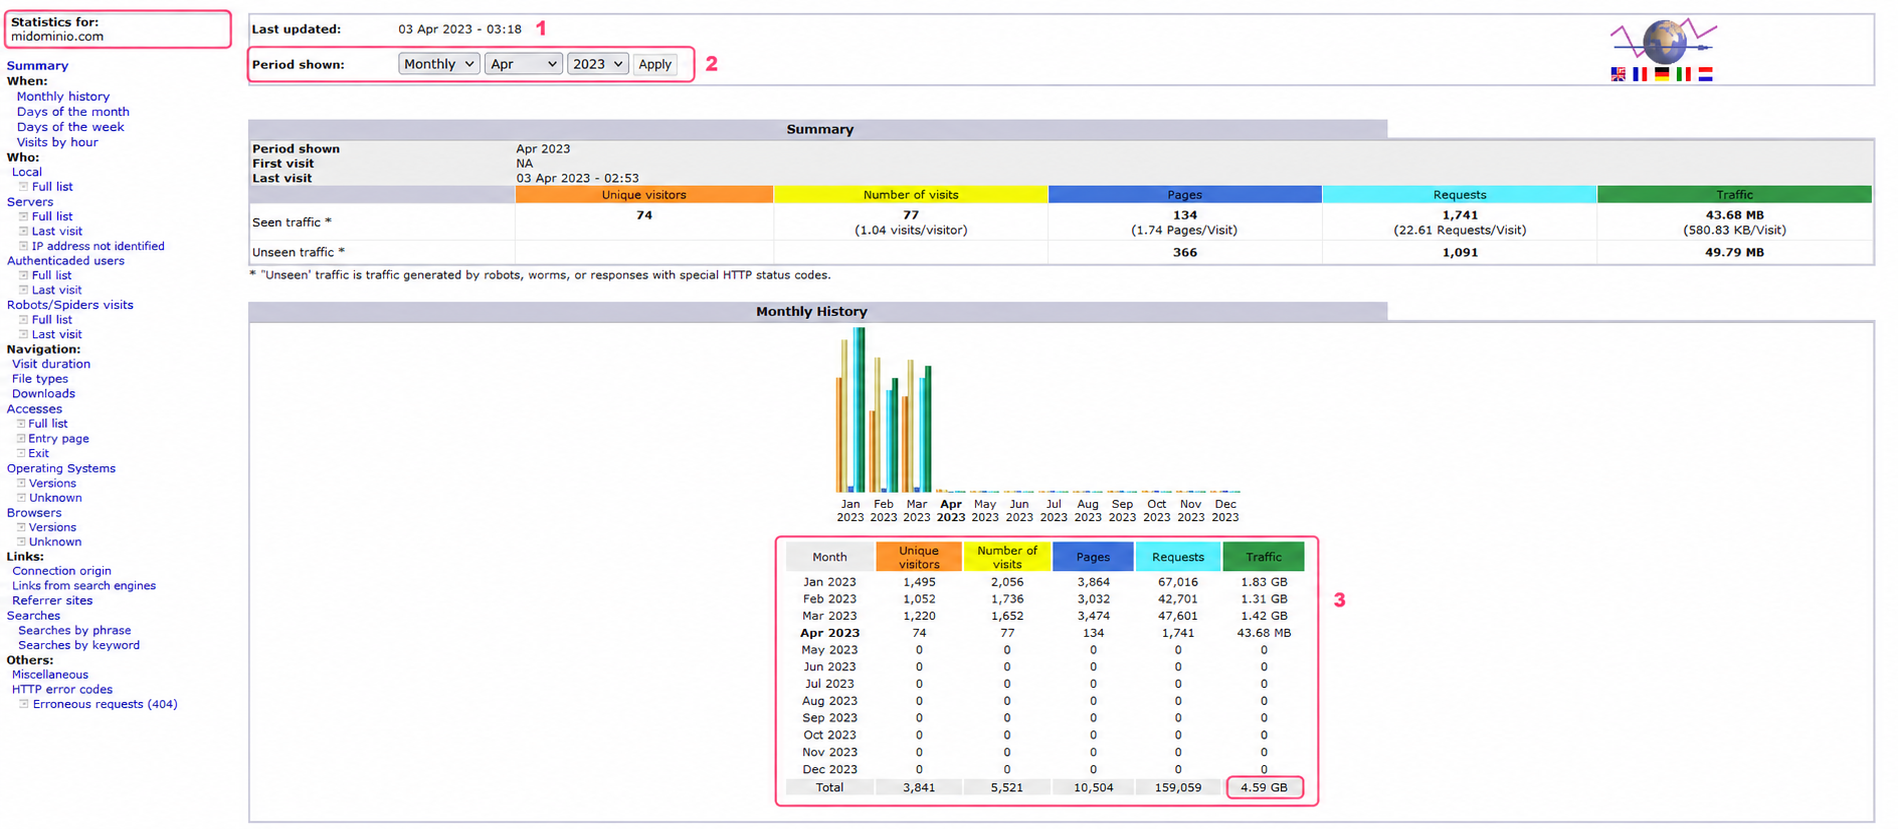
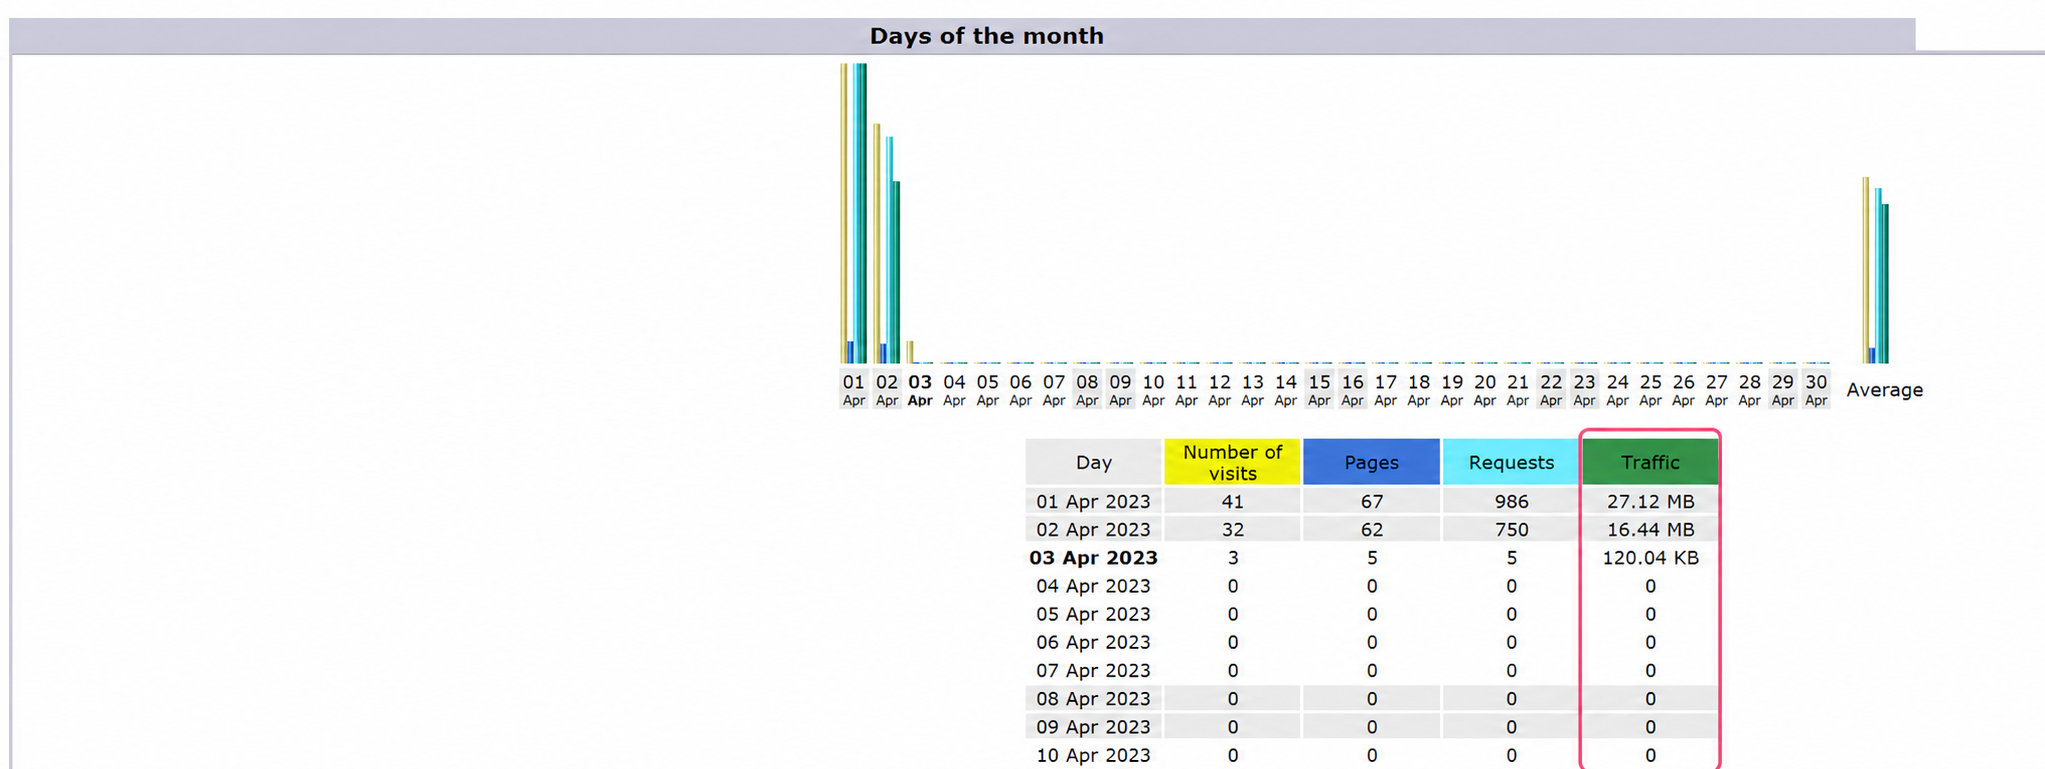
Similarly, Awstats will show bandwidth usage in various ways; in each section the most important value is always Traffic.
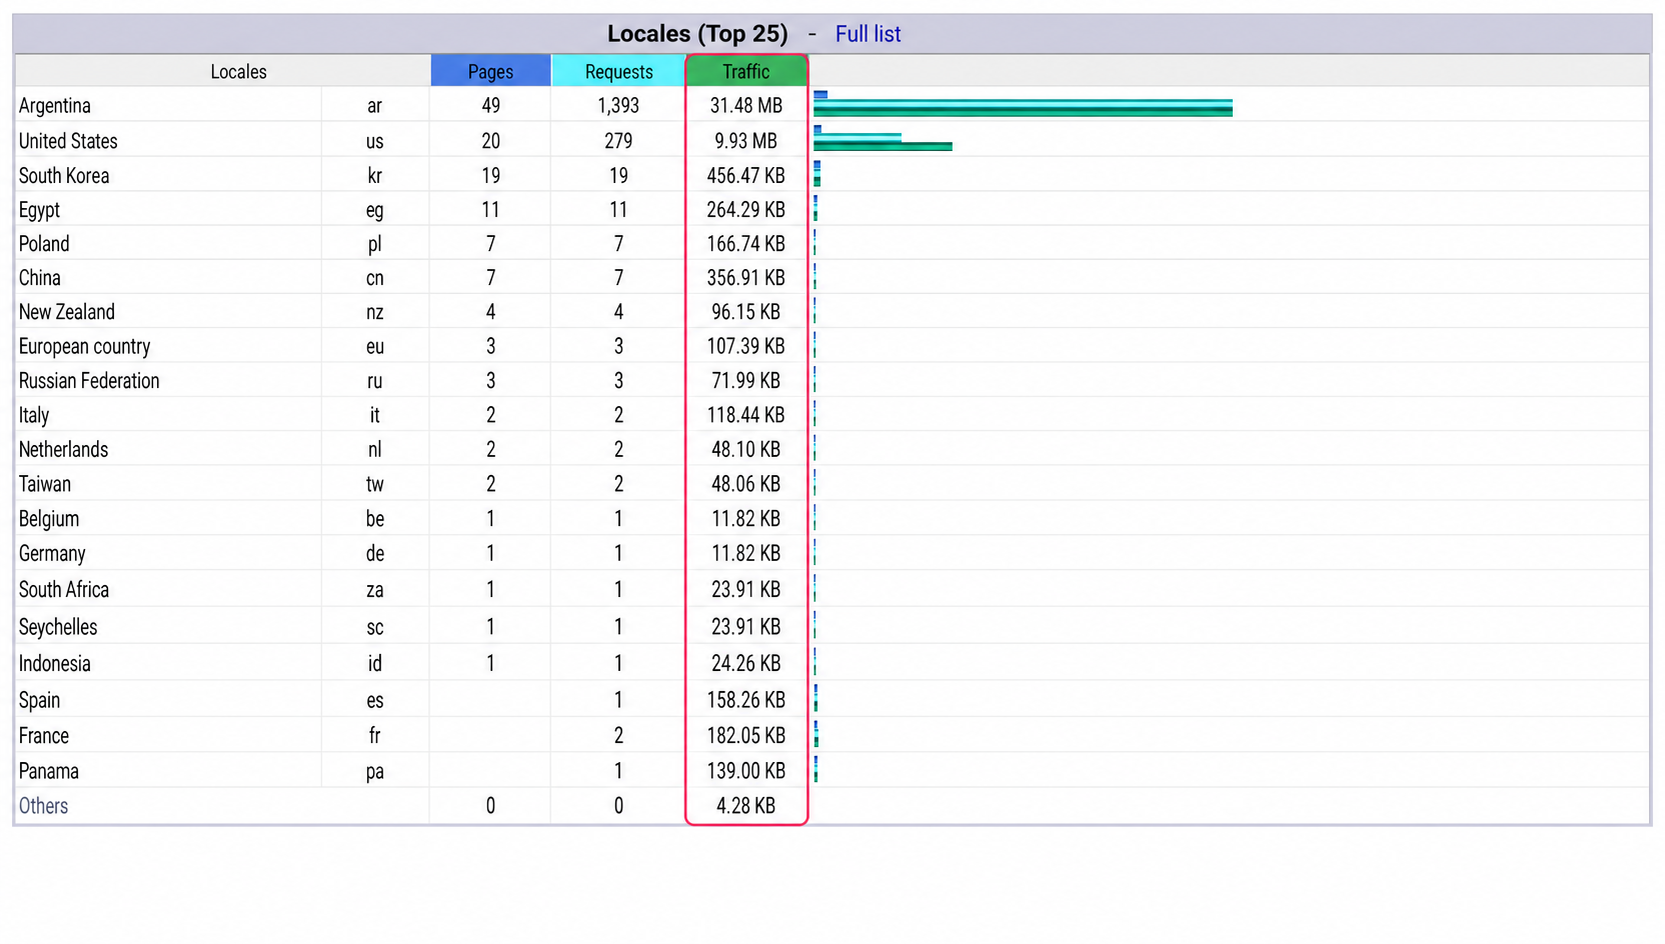
In the section of the image below, you will see usage by country; this is another area where you can determine if there is unusual bandwidth usage depending on where it originates.
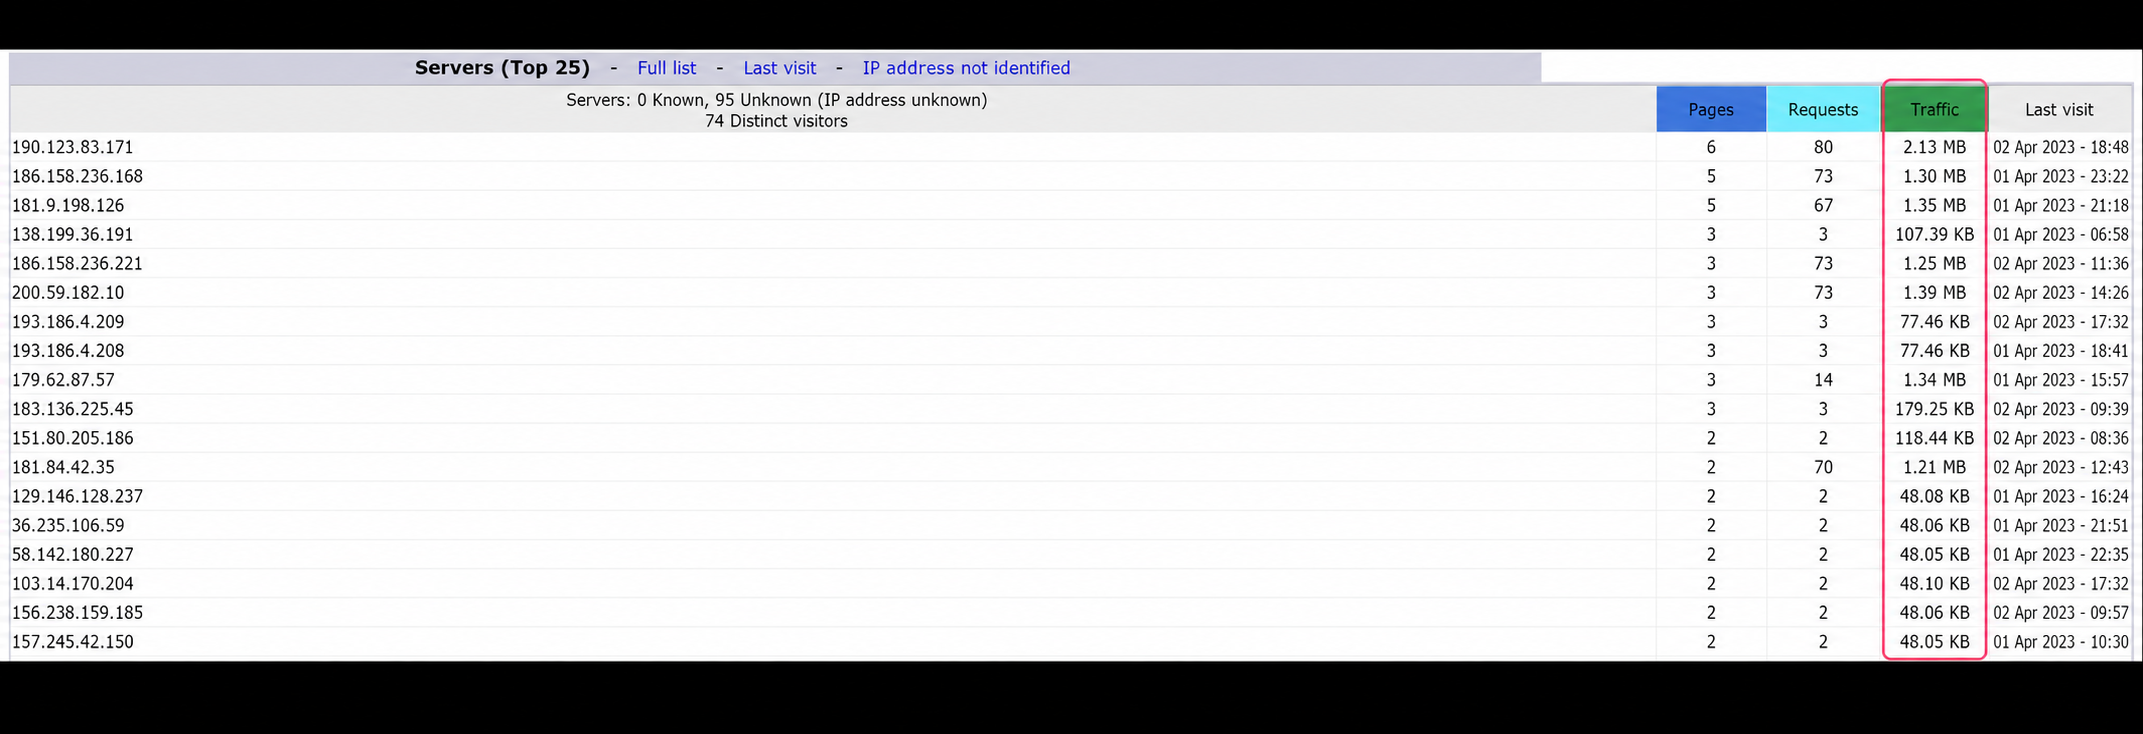
Next you will find usage by IP connections. In general, this section often shows unusual usage. Normally, you should find fairly even usage among all connections.
Below, you will find the usage generated by Robots, Bots, Crawlers, etc. This section is very important to review; these bots are the second most common cause of high bandwidth usage.
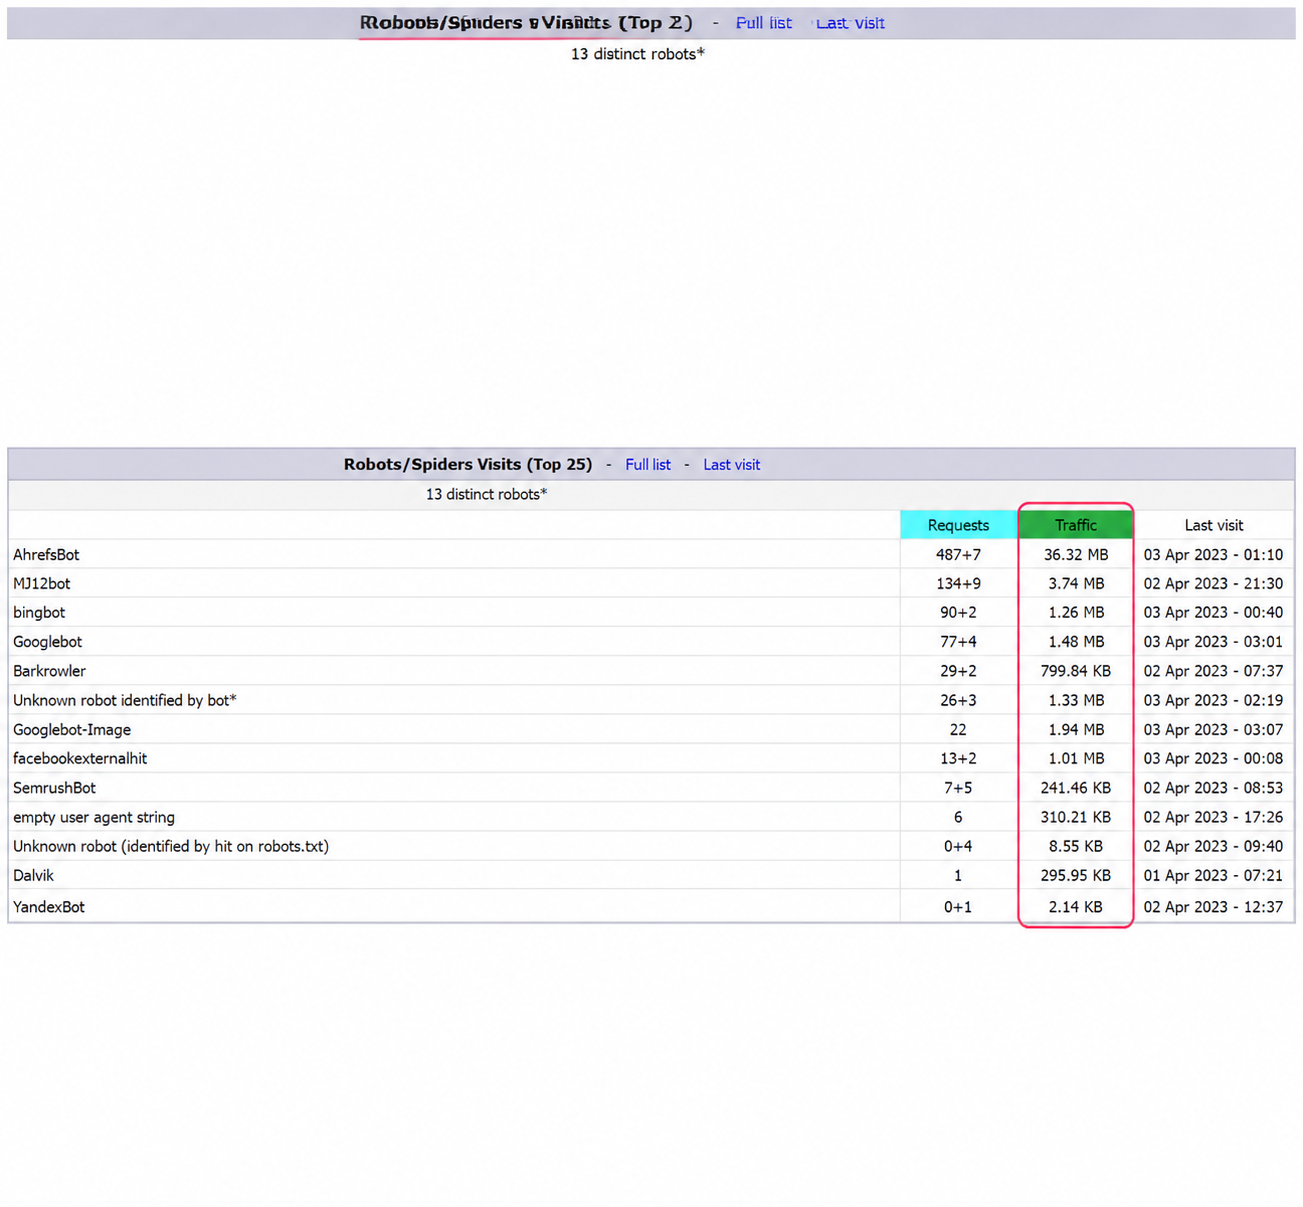
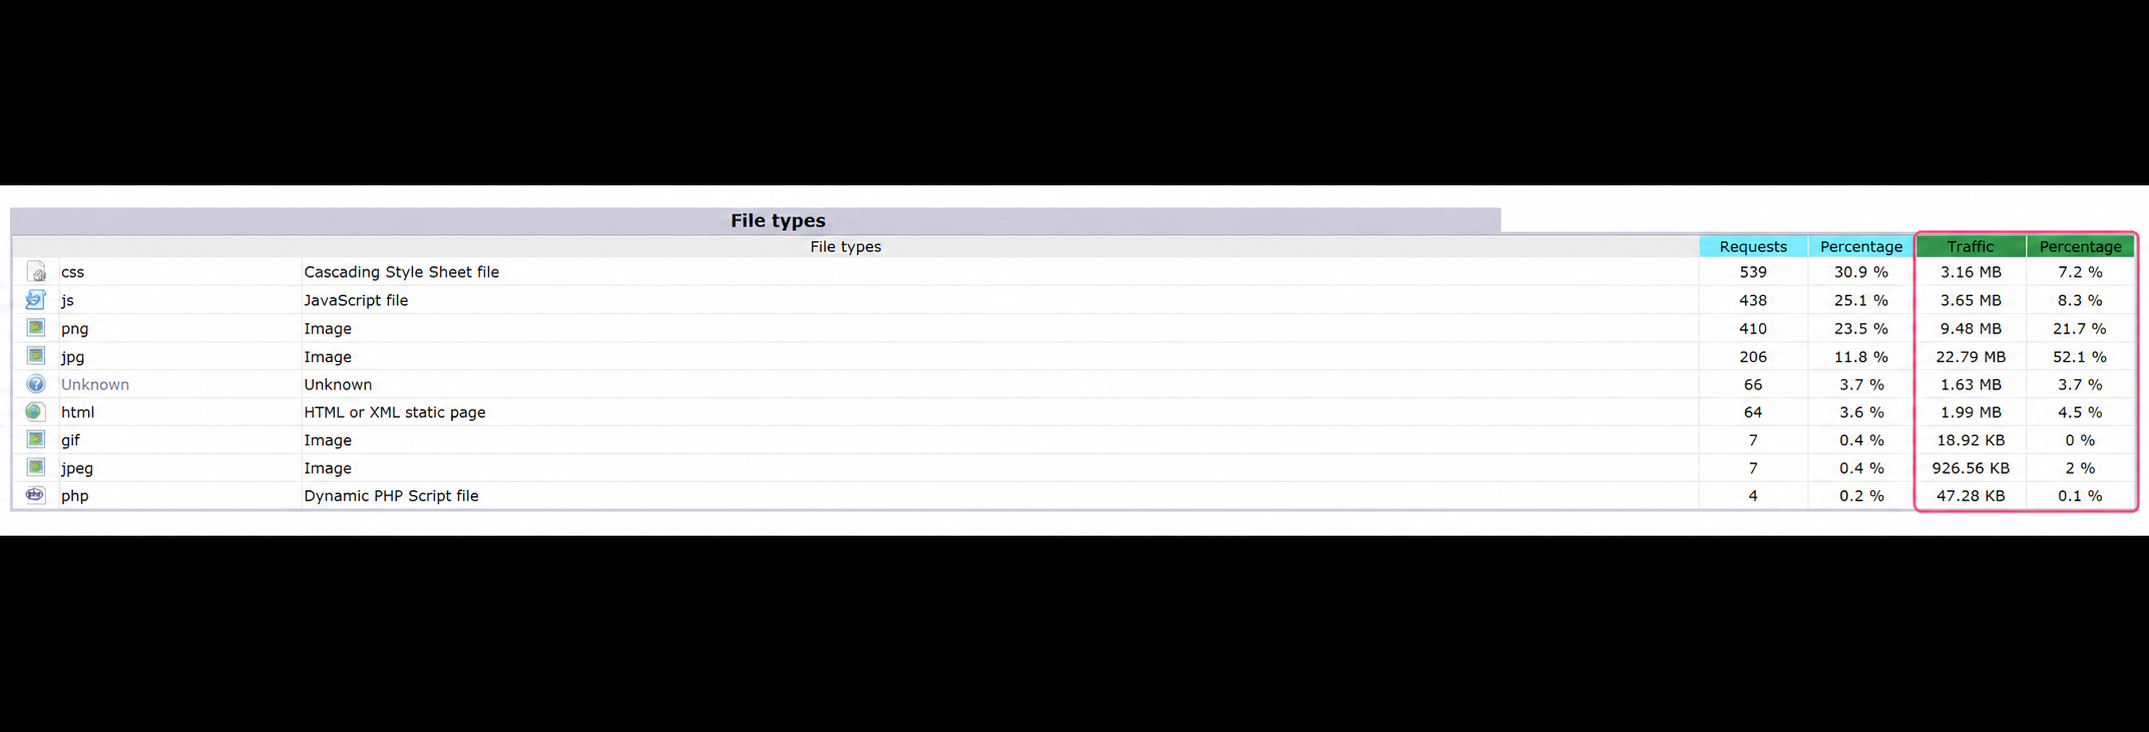
Then you will see the most important section of all when reviewing bandwidth usage in your account. In this section you will see bandwidth usage by specific resources of your website (script execution, images, videos, etc.).
This is the most frequent cause of bandwidth usage on your account: visits to the website itself. Of all your website resources, images or similar multimedia files almost always consume the most bandwidth.
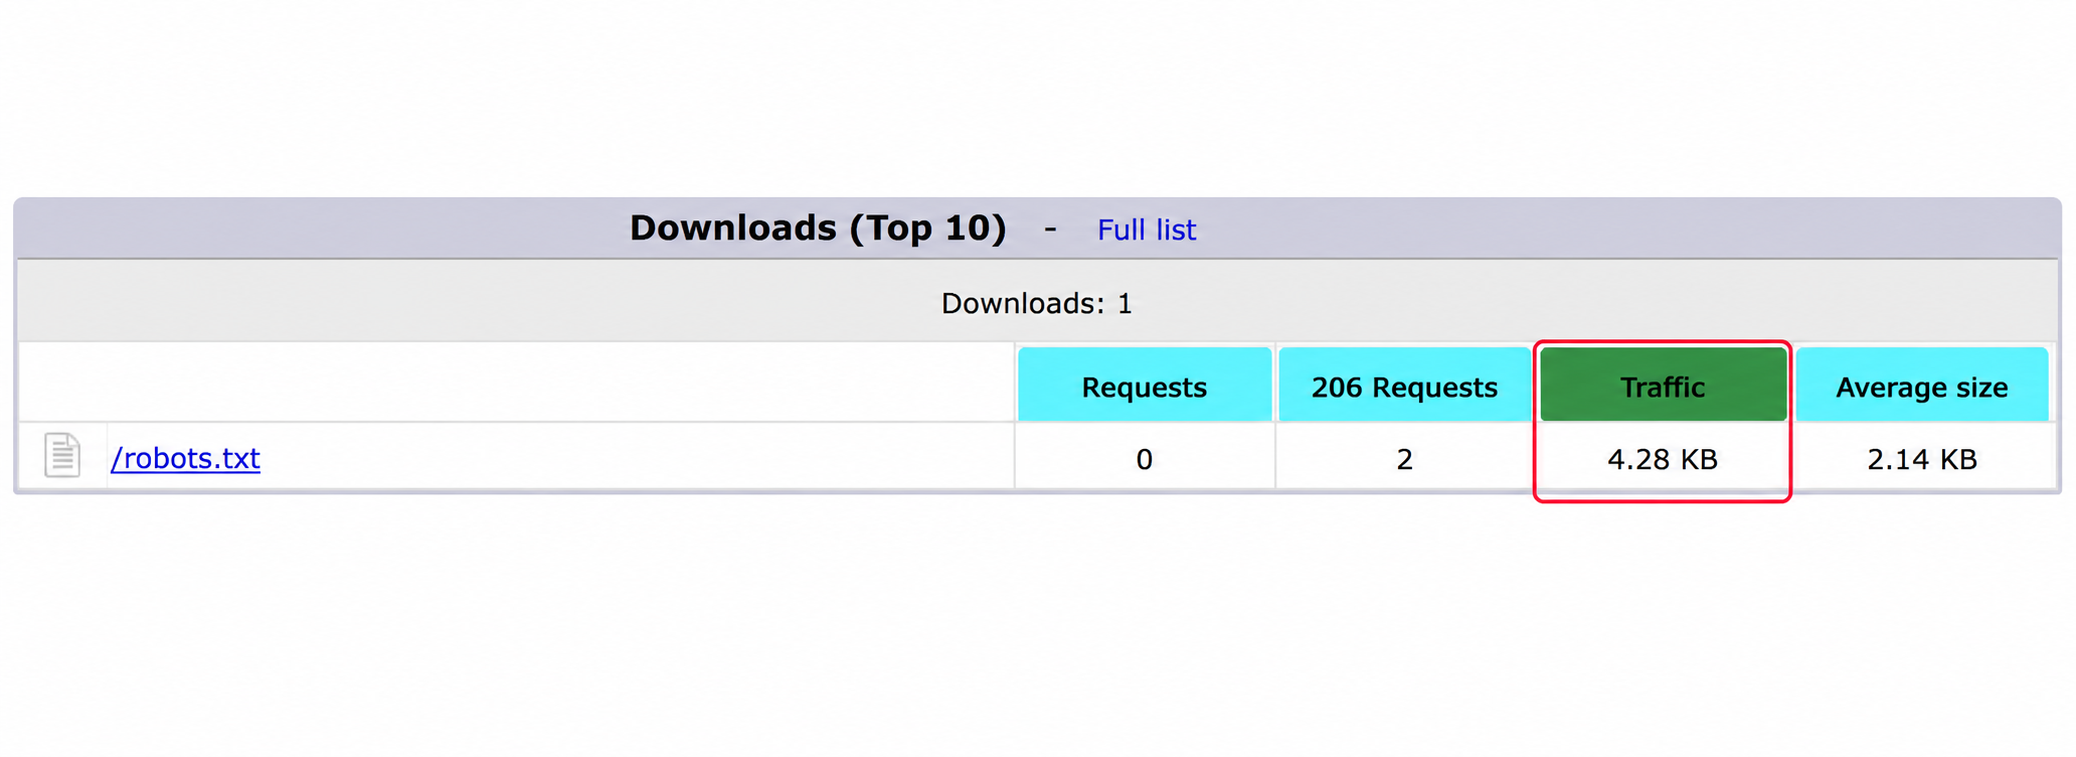
Finally, you will find the Download section, which will show usage by direct downloads you may have on your website.
By reviewing each section or area of this tool you can find what consumes the most bandwidth on your website. You can even detect suspicious usage or abuse of your website. If that is the case, do not hesitate to contact us so we can review your account.