
How do I monitor the server load?
The Task Monitor allows you to view the server load across its various services, showing CPU, RAM, bandwidth, etc.
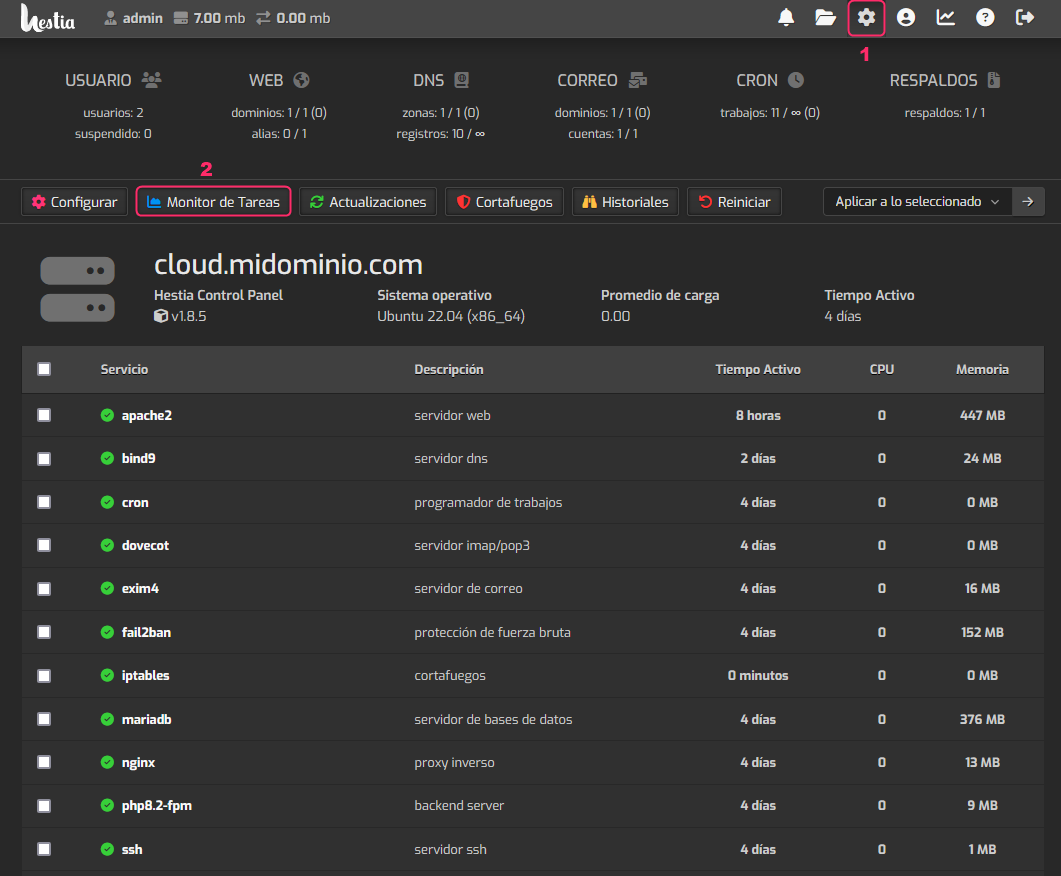
To access the Task Monitor, follow these steps:
- Click the gear icon in the top menu.
- Then, go to Task Monitor.
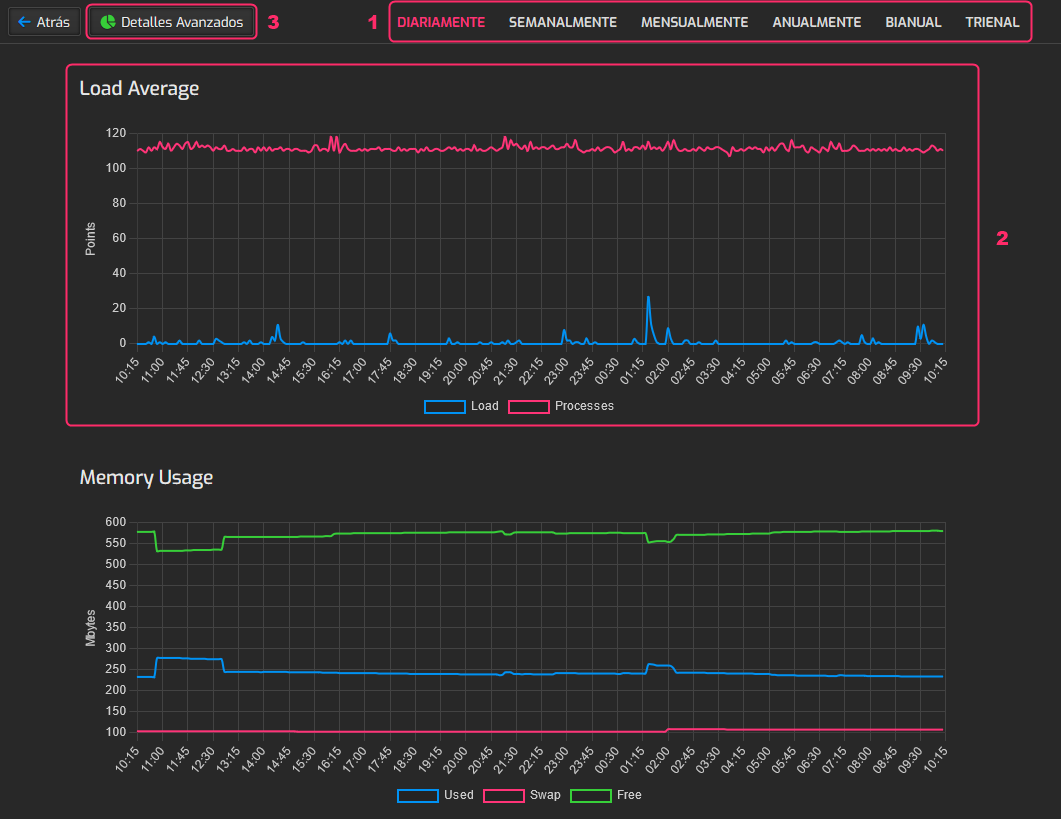
On the Task Monitor screen you will see the following information:
- You will see a time selector to analyze the load at that moment.
- You will see graphs of overall load, by hardware component, and by service.
- If you click the Advanced Details button you will see a snapshot of the server load at that moment, as it would appear via SSH.